Unit 7- Energy Balance and Obesity
7.3 Assessing Body Weight
Determining Your Healthy Size
There are many methods used to assess body weight and composition, but none give a complete picture of your health. That requires a truly individual assessment of a your overall health and well-being, not just the numbers on a scale and a measuring tape. Overall, a healthy size should not be dictated by a formula, the latest fad, or societal expectations. We all come in different shapes and sizes. Yet it’s also worth understanding some of the measures used to estimate desirable body weight and composition, the benefits of their use in assessing health status, and their limitations. The following sections discuss four methods, two that only consider body weight and two that consider the amount and location of body fat.
Estimating “Ideal” Body Weight
Have you ever wondered how much you should weigh? For many years, nutrition and health professionals have used the simple “100 plus 5” method to estimate a person’s ideal body weight. (It’s “106 plus 6” for men.) Dr. G.J. Hamwi developed the formula in 1964 as a fast and easy way to determine desirable body weight for his patients. Although it’s criticized by some health professionals today, the ease of its use makes it worth mentioning in an introductory nutrition textbook. You can easily remember the formula and do the math in your head.
For women, the Hamwi formula is determined by using 100 pounds for the first 5 feet of height and adding 5 pounds for each additional inch. So an adult female who is 5 feet, 6 inches should weigh 130 pounds. This is calculated by using 100 plus 30, for 5 X 6 (inches). Because some of us have small frames and others have large ones, add or subtract 10 percent. For our 5-feet, 6-inches woman, 10 percent of 130 is 13, so she should weigh between 117 and 143 pounds.
For teen boys and men, the formula uses 106 for the first 5 feet in height and adds 6 pounds per inch, plus or minus 10 percent to account for frame size.
For example, to calculate for a man who is 5-feet, 10 inches, use the following:
106 lbs. + 60 lbs. = 166 lbs. Add/subtract 10 percent for frame size (+/-16.6 lbs.)
So, the man should weigh 166 lbs. If he has a small frame, he might weigh 149.4 lbs. and 182.6 lbs for a large frame.
Body Mass Index (BMI)
Body Mass Index (BMI) is similar to the “10 plus 5” formula in that it considers your height and weight. However, instead of telling us what we should weigh, BMI assesses our weight relative to our height. Although the terms overweight and obese are often used interchangeably, they denote different things. BMI is the most common method used to differentiate between the two, however it’s not a perfect method as discussed later in this section. One problem is that BMI is not a direct measure of body fat, so it shouldn’t be used on its own to diagnose obesity or the health of an individual.[1]
BMI calculations
Calculating the BMI is a little more complex that using the “100 plus 5” estimation. It’s calculated using either the metric system orimperial system of measuring as below:
Metric: BMI = [weight (kg)/height (m2)] metric
OR
Imperial system: BMI = [weight (lb)/height (in2)] x 703.
Use of the metric method requires converting pounds to kilograms and inches to meters.
- To convert pounds to kilograms, divide by 2.2. (130 lbs ÷ 2.2 = 59 kg)
- To convert inches to meters, divide by 39.37. (66 ÷ 39.37 = 1.67)
- Then square the meters by multiplying the number by itself. (1.67 x 1.67 = 2.78)
- The calculation for BMI formula is : 59 kg. ÷ 2.78 = 21.22.
- Therefore, the BMI = 21
A much simpler way is using CDC’s online BMI calculator for adults age 20 and older.
BMI Weight Status Categories For Adults
BMI categorizes weight status into one of the following:
- Underweight – BMI < 18.5
- Normal weight – BMI from 18.5-24.9
- Overweight – BMI from 25-29.9
- Obese – BMI from 30 or higher
Because the degree of obesity around the globe is increasing, the obese category is frequently divided into the following sub-groups:
- Class 1 obesity: BMI of 30 to < 35
- Class 2 obesity: BMI of 35 to < 40
- Class 3 obesity: BMI of 40 or higher
Did you notice?
Did you notice that the estimated “ideal body weight” using the “100 + 5” rule for a 5 feet 6 inches woman is 130 pounds. This height and weight combination results in a BMI of 21, which is classified in the normal weight category. In fact, adding or subtracting 10 percent to the weight is still within the normal BMI weight range.
Asian-Pacific BMI Classifications
Because Asians have smaller frame sizes than other races, a different set of BMIs are used to define their weight status. These BMI ranges are lower than the standard ones outlined above. The Asia-Pacific BMI range definitions are:
- Underweight – BMI < 18.5
- Normal weight – BMI from 18.5-22.9
- Overweight – BMI from 23-24.9
- Obese – BMI from 25 or higher [2]
BMI for Children and Teens
Body fatness changes with age and differs between boys and girls. Therefore, CDC recommends using BMI-for-age percentiles to assess body weight for individuals ages 2 through 19 years. Determining BMI-for-age requires determining the BMI then plotting it on a CDC growth chart like the one below. Because of the differences in growth rates, CDC has one growth chart for girls and a separate one for boys as below. Similar to the adult BMI online calculator, CDC has a BMI-for-age calculator and CDC’s website available at: https://www.cdc.gov/healthyweight/bmi/calculator.html.
 BMI-for-age growth charts are used to determine weight status of individuals ages 2 to 12 years. A healthy BMI-for-age range, illustrated in green, ranges from the 5th to the 85th percentile. For a 10-year-old boy, this translates to a BMI of 14 to 19, which is in the underweight BMI range for adults. (Note: A boy who is 56 inches tall could weigh between 60 and 80 pounds and fall within “healthy weight” range.) Image source CDC. [3]
- Underweight – Less than the 5th percentile BMI-for-age
- Healthy weight – Between the 5th up to the 85th percentile BMI-for-age
- Overweight – Between the 85th up to the 95th percentile BMI-for-age
- Obese – At or above the 95th percentile BMI-for-age
Interpreting BMI
In general, BMI in the “normal” or “healthy” range is associated with better health compared to both underweight and overweight or obese values, because there are risks of carrying both too little and too much body fat. When researchers have looked at BMI and health in large groups of people, they generally find that the lowest risk of disease and of dying younger is in the range of BMI of 20 to 25.
As BMI values increase into the overweight and obese ranges, the risk of developing type 2 diabetes, cardiovascular disease and stroke, and even cancer increase, as well as other complications of obesity, such as osteoarthritis. [4] Carrying extra weight not only puts a mechanical strain on the body, but it also negatively impacts metabolic health and increases inflammation.
Limitations of BMI
Although BMI is simple and easy to calculate, it also has several important limitations. Since it’s only based on weight and height, it doesn’t distinguish between muscle mass and adipose tissue. It’s not unusual for muscular athletes to be classified as overweight, or even obese, based on BMI, but this can be misleading, because they may have very low amounts of body fat. On the flipside, BMI can underestimate body fatness in someone with very low muscle mass, such as a person who is elderly and frail.
In addition, BMI can’t tell us where body fat is located in the body, and as we’ll learn, this is a major factor determining its impact on health. The correlation between BMI and body fatness is fairly strong, but even if two people have the same BMI, their level of body fatness may differ.BMI’s accuracy in predicting body fatness is also affected by sex and race—not surprising given the natural diversity in shape and size of human bodies. In general, at the same BMI:
- Women tend to have more body fat than men.
- Whites have more body fat than Blacks.
- Asians have more body fat than Whites.
- Older people tend to have more body fat than younger adults.
- Non-athletes have more body fat than athletes.[5]
All of this means that BMI is not particularly useful for comparing one individual to another individual, or even one population to another. This one number simply doesn’t account for all of the underlying diversity in factors like body type, muscle mass, biological sex, and race. And for an individual, one BMI measurement at a single point in time may not be all that meaningful—other measurements and clinical assessments are needed to diagnose obesity and more accurately assess disease risk, as we’ll discuss in a moment.
BMI is perhaps most useful for tracking changes in body composition over time, whether of a population or an individual. For example, the data on average BMI in the U.S. show a clear increase over the last several decades, and the most likely explanation for that is not that people in the U.S. are all gaining several pounds of muscle each year, but that we’re putting on more fat. On the other hand, someone may have a BMI classified as overweight, but if they’ve been at that BMI their entire adult life and are active and metabolically healthy, that may just be the natural size and shape of their body
Measuring Body Composition
A person’s body mass is composed of water, lean body mass (including organs, bone, and muscle), fat, and other components like minerals. The weight on the scale does not distinguish between these different components, but body composition measurements can.
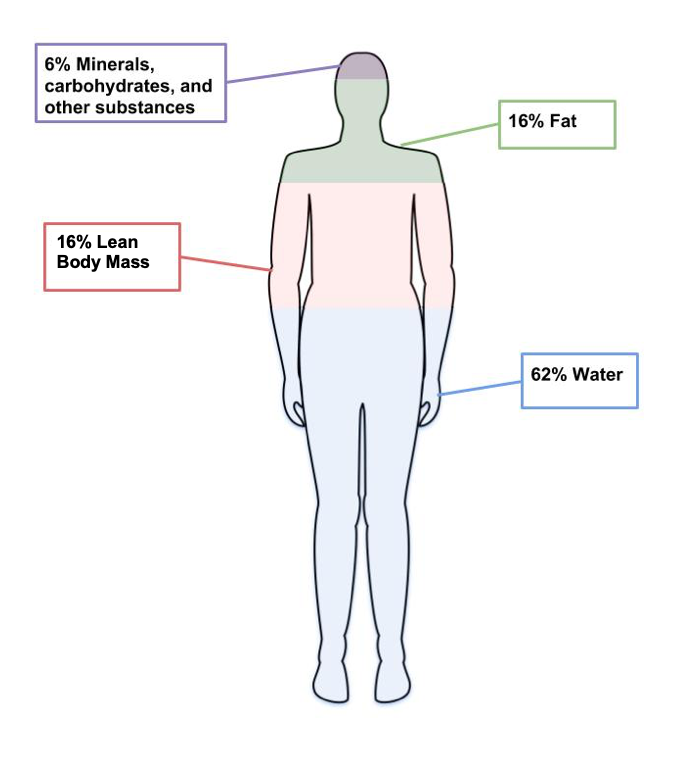
Figure 7.8. The four main components of body weight are water, fat, lean body mass and other components like minerals.
Techniques used to assess body composition
Body composition measurements determine how much of a person’s weight is made up of body fat and lean body mass. An individual might use body composition measurements to track their progress in building muscle with a new strength training program. Since increased body fat is often a risk factor for diseases like cardiovascular diseases and diabetes, researchers are often interested in this type of data. There are several different methods used to measure body composition, each with advantages and limitations.[6]
- Skinfold test. This is a simple, non-invasive, and low-cost way to assess fat mass. Calipers are used to measure the thickness of skin on three to seven different parts of the body. Keep in mind that the accuracy of the skinfold test depends on the skill of the person taking the measurements and the accuracy of the calipers.
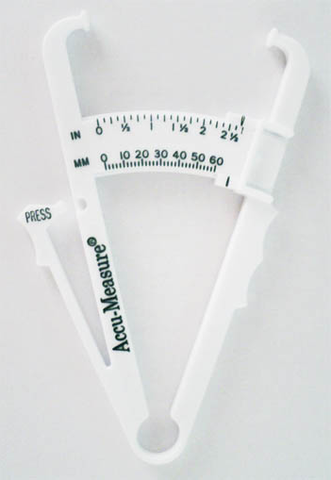
Figure 7.9. Calipers used to assess body fat during skinfold testing.
- Bioelectric Impedance Analysis (BIA). This is a simple, non-invasive, quick tool that does not require extensive training. BIA estimates body composition by sending a small amount of electricity through the body. Since water is a good conductor of electricity, and lean body mass contains more water than fat, the rate at which the current travels can be used to estimate percent body fat. Body fluid levels must be normal with BIA, which is a limitation, since hydration can be impacted by exercise, alcohol, and menstrual cycles.
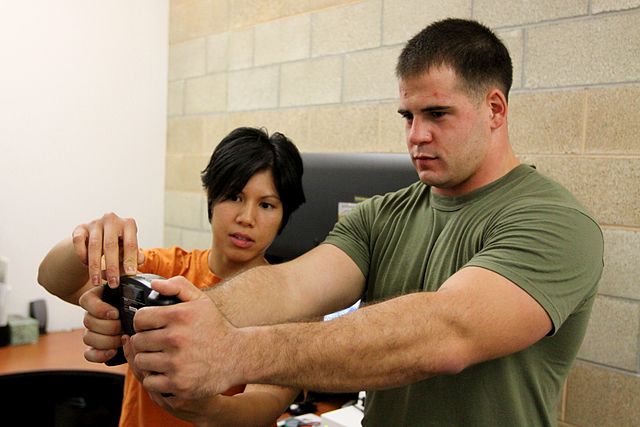
Figure 7.10. BIA hand device.
- Air displacement plethysmography (ADP) – This is a non-invasive, quick tool that does not take extensive training. It’s more accurate but also more expensive than BIA. While a person sits inside an enclosed chamber (usually called a Bod Pod), changes in air pressure are used to determine the amount of air that is displaced in the test chamber, which can determine body volume. These measurements are then translated into percent body fat. Hydration status can affect the accuracy of this test. This test also needs to be conducted in a facility with a Bod Pod, so it is not as accessible as the skinfold test or the BIA.
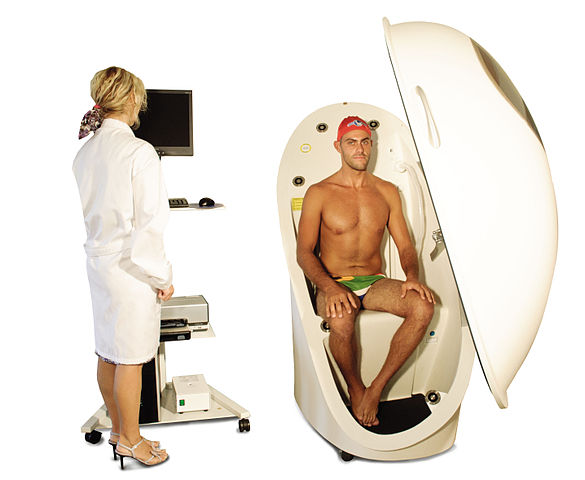
Figure 7.11. Body composition measurement with whole-body air displacement plethysmography (ADP) technology or BodPod
- Dual-energy X-ray absorptiometry (DXA). This method directs two low-dose X-ray beams through the body and determines the amount of energy absorbed from the beams. The amount of energy absorbed is dependent on the body’s content of bone, lean tissue mass, and fat mass. Using standard mathematical formulas, fat content and bone density can be accurately estimated. Although this is one of the most accurate methods of measuring fat mass, it is expensive and mostly used in research. It also requires low doses of radiation to the subject being tested, and is not appropriate for pregnant women.
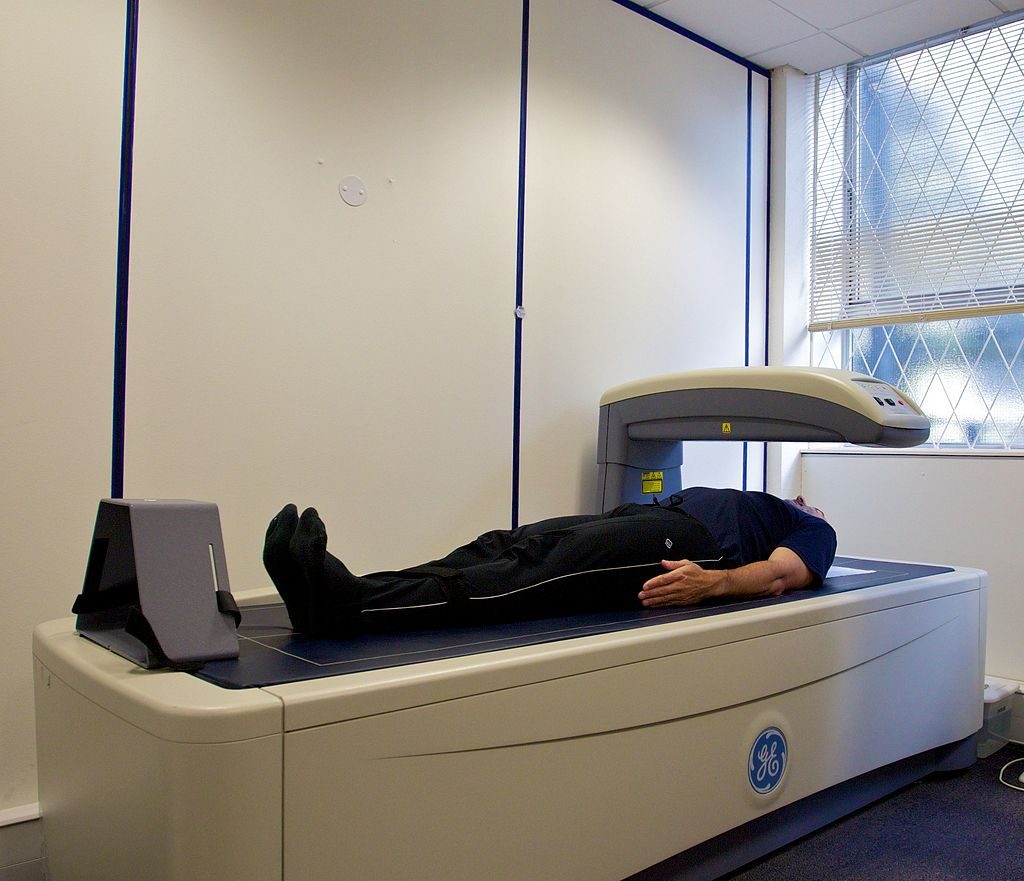
Figure 7.12. Dual-Energy X-ray Absorptiometry (DXA)
Keep in mind that body composition can be hard to measure accurately when using inexpensive and accessible techniques like skinfold testing and BIA. Your best bet is to pick one method and use that method over time to compare numbers and see how they change. Just don’t get too hung up on the actual number, as the accuracy will be questionable depending on the method chosen.
Measuring Fat Distribution
Total body fat is one predictor of health; another is how the fat is distributed in the body. The location of fat is important, because people who store fat more centrally (apple-shaped) have a higher risk for chronic disease—like cardiovascular disease and type 2 diabetes—compared to people who store fat in the hips, thighs, and buttocks (pear-shaped). This is because visceral fat that surrounds vital organs (common in central obesity or apple-shaped fat patterning) is more metabolically active, releasing more hormones and inflammatory factors thought to contribute to disease risk compared to subcutaneous fat. Subcutaneous fat stored just below the skin (common in pear-shaped fat patterning) does not seem to significantly increase the risk for chronic disease.
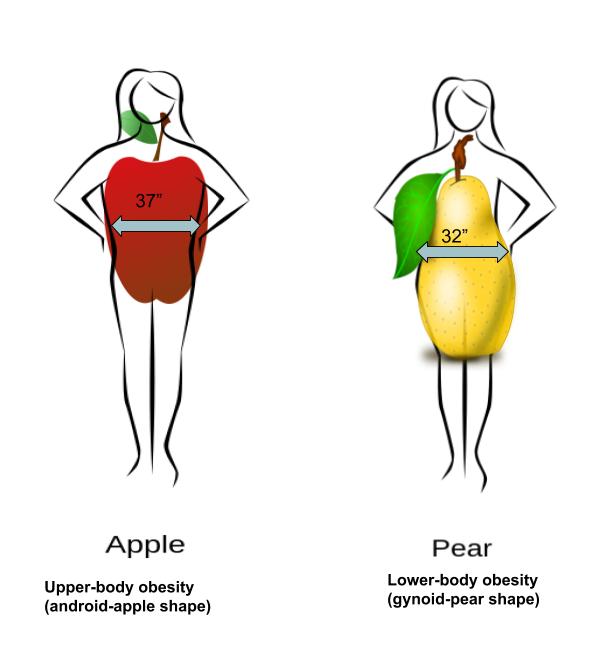
Figure 7.13. Fat can be located in the abdominal region (apple shape) or hips, thighs, and buttocks (pear shape).
Body fat distribution can be measured by waist circumference and waist-to-hip ratio, both of which only require a measuring tape.
- Waist circumference is measured just above the hip bone, level with your belly button. Men with a waist circumference greater than 40 inches and women with a waist circumference greater than 35 inches are predicted to face greater health risks.
- Waist-to-hip ratio is calculated by measuring waist circumference and hip circumference (at its widest part) and dividing the two values. Abdominal obesity is defined by the World Health Organization as a waist-to-hip ratio above 0.90 for males and above 0.85 for females.

Did you know?
Cellulite is the lumpy, dimpled skin that many females complain about. Because of the name, some people confuse it with the fiber cellulose. However, the two are not related.
Cellulite is just a build up of fat under the skin. It’s mainly seen in the hips and thighs of women. About 80 to 90% of women have it and is more common in obese individuals.
Indicators of Metabolic Health
Metabolic health refers to the body’s ability to maintain desirable blood pressure, blood lipids, and blood glucose. It is assumed that when an individual is classified as overweight and obese, based on measurements of BMI and body fat composition and distribution, metabolic health is negatively impacted. However, some individuals that meet the criteria for obesity do not experience an increased risk of metabolic health. These individuals are known as “metabolically healthy obese” (MHO). You are considered to be metabolically healthy if you have no signs or symptoms of type 2 diabetes, heart disease, or other diet-related conditions.
In contrast, some people are classified as a healthy weight (BMI < 25) but show an increased metabolic risk. A person who has a poor diet, does not get regular physical activity, and is a normal weight, might be considered to be metabolically obese normal weight (MONW). [7]
These two variations challenge the assumptions we hold about body fatness. It can not always be assumed that thinness equals healthy, and fatness equals unhealthy.
).
Review Questions
y, and fatness equals unhealthy
- Centers for Disease Control and Prevention. (2019, March 1). About Adult BMI | Healthy Weight | CDC. Retrieved February 2,2022 from https://www.cdc.gov/healthyweight/assessing/bmi/adult_bmi/index.html ↵
- Lim JU, Lee JH, Kim JS, et al. Comparison of World Health Organization and Asia-Pacific body mass index classifications in COPD patients. Int J Chron Obstruct Pulmon Dis. 2017;12:2465-2475. Published 2017 Aug 21. doi:10.2147/COPD.S141295 ↵
- CDC. About Child and Teen BMI. Retrieved January 31, 2022 from https://www.cdc.gov/healthyweight/assessing/bmi/childrens_bmi/about_childrens_bmi.html ↵
- Bhaskaran, K., dos-Santos-Silva, I., Leon, D. A., Douglas, I. J., & Smeeth, L. (2018). Association of BMI with overall and cause-specific mortality: A population-based cohort study of 3·6 million adults in the UK. The Lancet. Diabetes & Endocrinology, 6(12), 944–953. https://doi.org/10.1016/S2213-8587(18)30288-2 ↵
- Centers for Disease Control and Prevention. (2019, March 1). About Adult BMI | Healthy Weight | CDC. Retrieved February 2,2022 from https://www.cdc.gov/healthyweight/assessing/bmi/adult_bmi/index.html ↵
- Lemos, T., & Gallagher, D.( 2017). Current body composition measurement techniques. Current Opinion in Endocrinology & Diabetes and Obesity, 24(5), 310–314. doi: 10.1097/MED.0000000000000360 ↵
- Matthew, H., Farr, O.M., & Mantzoros, S.C. (2016). Metabolic Health and Weight: Understanding metabolically unhealthy normal weight or metabolically healthy obese patients. Metabolism, 65(1), 73-80. doi: 10.1016/j.metabol.2015.10.019 ↵
Have a BMI between 25 up to 30, or weighing about 25 lbs more than is desirable.
WHO considers it as an "abnormal or excessive fat accumulation that may impair health." Having a BMI over 30. Most people weigh 50 pounds or more than is desirable.
The system of measurement that uses the meter, liter, and gram as base units of length (distance), capacity (volume), and weight (mass) respectively.
A system of measurement in use in the United States, United Kingdom, and other Commonwealth countries consisting of units such as the inch, the mile, and the pound.
