
Unit 7- Energy Balance and Obesity
7.5 The Obesity Epidemic
“Obesogenic” is a word coined in the last two decades. It refers to an environment that promotes increased food intake, sugary and high-fat foods, and inactivity. The CDC reports that in 2018 in the United States, more than two in five adults [1] and one in five children were obese [2]. And the obesity rates of Americans continue to rise.
The health consequences of too much body fat are numerous, including increased risks for cardiovascular disease, type 2 diabetes, and some cancers. The medical costs related to obesity are enormous. Obese people spend close to $1,500 more per year for medical care than people of healthy weight.
Numerous obesogenic agents contribute to this immense public health problem have become part of everyday life. Some examples are listed below:
- The fast food industry has been growing for decades and continues to grow despite the latest economic slump.
- Food portions have been getting bigger since the 1960s.
- During the 1990s, America experienced the “super-size” marketing boom, which still endures.
- Today, very few people walk or ride bikes to work or school.
- In the 1960s, walking and biking were common among all age groups.
- Escalators, elevators, and moving walkways dominate shopping malls and office buildings.
- Factory work has become increasingly mechanized and robotized.
The list of obesity-promoting factors goes on and on. They result from modernization, industrialization, and urbanization continuing without public health officials or government adequately addressing the concurrent rise in overweight and obesity.
Obesity Rates
Since 1960, the prevalence of overweight has remained fairly constant, but obesity and severe obesity rates have increased dramatically. Data collected by the CDC in Figure 7.17 show rising obesity among men and women from about 10 percent in 1960 to more than 40 percent in 2018. Severe obesity was almost nonexistent in 1960, and is approaching 10 percent of the female population today.severe obesity
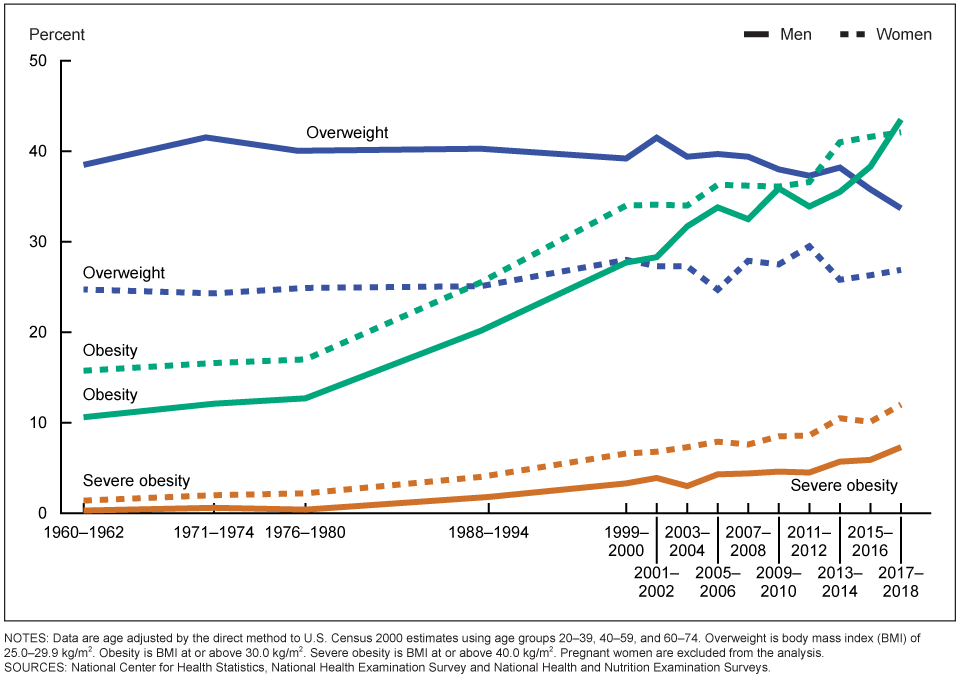 Figure 7.16 Trends from 1960 to 2018 of US adult overweight, obesity, and severe obesity of men and women based on NHANES data in which people are measured by trained professionals. Visit https://www.cdc.gov/nchs/data/hestat/obesity-adult-17-18/obesity-adult.htm to see prevalence by race/ethnicity
The 40 percent obesity rate shown above is based on results from the National Health and Nutrition Examination Surveys (NHANES). The heights and weights for NHANES are measured by trained professionals using standardized scales. So those NHANES figures are accurate. However, the data in maps of the states in Figure 7.18 are based on self-reported weights collected over the telephone as part of the Behavioral Risk Factor Surveillance System (BRFSS) . These data show much lower obesity rates. It is well-established that people underestimate their weight, which provides lower obesity rates than data collected with NHANES. Colorado’s and Hawaii’s rates are about 20 percent, with the Southern states between 35 to 40 percent.
 Figure 7.17. Prevalence of self-reported obesity of US adults based on data from BRHSS . To see obesity data based on race/ethnicity visit: https://www.cdc.gov/obesityCh/data/prevalence-maps.html#overall
Childhood Obesity
These trends are unmistakable, and they’re not just occurring in adults. Obesity among children has seen similar increases over the last few decades—perhaps a more significant concern as the metabolic and health effects of carrying too much weight can be compounded over a person’s entire lifetime. As noted in Figure 7.19, fewer than 5 percent of children were obese in 1960. This number has quadrupled to a staggering 20 percent. The slight decreases in the early 2000s are related to childhood obesity awareness programs. For example, Michelle Obama launched Let’s Move during the Obama administration. However, these types of programs were very short-lived
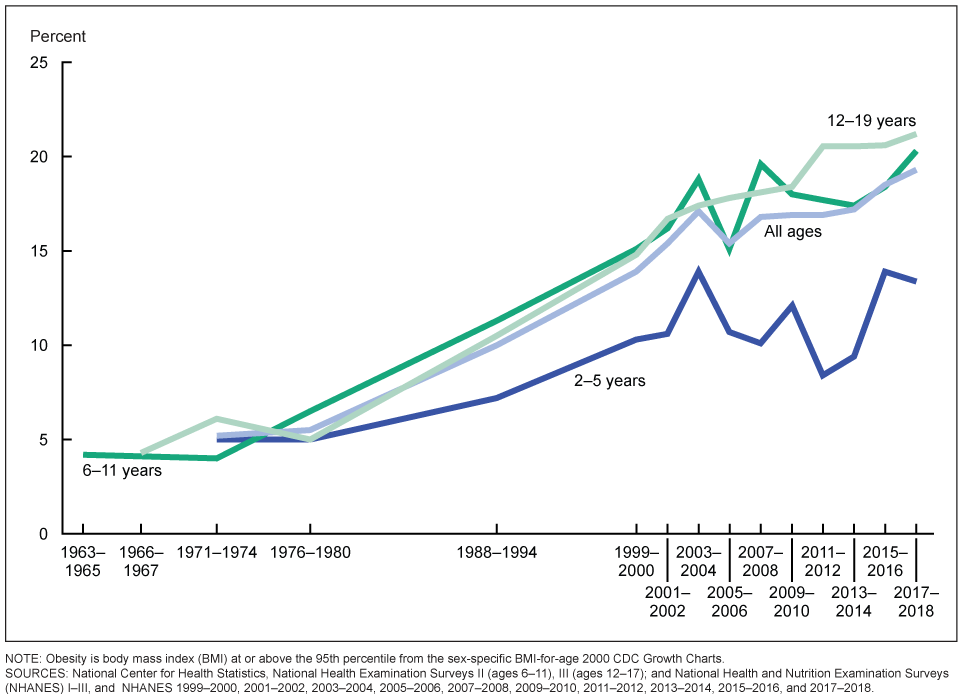 Figure 7.18. Prevalence obesity among US children and teens from1963 to 2018 by age category. (2 to 5, 6 to 11, and 12 to 19 years.) For information obesity by race/ethnicity, visit https://www.cdc.gov/nchs/data/hestat/obesity-child-17-18/obesity-child.htm#:~:text=Results%20from%20the%202017%E2%80%932018,and%20another%2016.1%25%20are%20overweight.
Obesity among Minority Groups
While obesity is a problem across the United States, it affects some of us more than others. Based on 2015-2016 data, obesity rates are higher among Hispanic (47 percent) and Black adults (47 percent) compared with white adults (38 percent). Non-Hispanic Asians have the lowest obesity rate (13 percent). (Recall from section 7.3 that Asians have higher percent body fat than other races, but the rates of obesity based on BMI is lower than other races.) And overall, people who are college-educated and have a higher income are less likely to be obese.2 These health disparities point to the importance of examining social context when examining causes and solutions. Not everyone has the same opportunity for good health or an equal ability to change their circumstances because of poverty and longstanding inequities in how resources are invested in communities. These factors are called “social determinants of health.”3
Global Obesity
The obesity epidemic is not unique to the United States; it’s a global problem. In 2015, obesity affected about 2 billion people worldwide, making it one of the biggest health problems in most countries.4 Globally, among children aged 5 to 19 years old, the rate of overweight increased from 10.3 percent in 2000 to 18.4 percent in 2018. In the past, obesity mainly affected high-income countries. Today, the problem is plaguing low-income countries. The culprit is the availability of inexpensive, processed foods.5
Despite the gravity of the problem, no country, including the US, has implemented policies that have reversed the trend and decreased obesity.6 The World Health Organization set a target of stopping the rise of obesity by 2025 but has fallen short of the goal. Correcting the problem will require understanding what is causing the obesity epidemic. Only when these causes are addressed can change can start to occur.
Causes of the Obesity Epidemic
If obesity were an infectious disease sweeping the globe like COVID-19, affecting billions of people’s health, longevity, and productivity, we indeed would have addressed it by now. Researchers and pharmaceutical companies would have worked furiously to develop vaccines and medicines to prevent and cure this disease. But the causes of obesity are much more complex than a single bacteria or virus. Solving this problem means recognizing and addressing the many factors that lead to weight gain in a population.
Behavior
At its core, rising obesity is caused by a chronic shift towards eating too many calories each day, leading to an often gradual but persistent increase in body weight. People often assume that this is an individual problem. Those who weigh more simply need to change their behavior to eat less and exercise more. If this doesn’t work, it must be because of a personal failing, such as a lack of self-control or motivation.
While behavior patterns such as diet and exercise can have a significant impact on a person’s risk of developing obesity (as we’ll cover later in this unit), the environments live in also significantly impact our behavior and make it much harder to maintain energy balance.
Environment
As noted earlier, many of us live in what researchers and public health experts call “obesogenic environments.” That is, how our neighborhoods are built influences our physical activity and food intake to encourage weight gain .7 Human physiology and metabolism evolved in a world where obtaining enough survival food required significant energy investment in hunting or gathering—very different from today’s world where more people earn their living in sedentary occupations. From household chores, to workplace productivity, to daily transportation, getting things done requires fewer calories than it did for past generations.

Figure 7.19. Some elements of our environment that may make it easier to gain weight include sedentary jobs, easy access to inexpensive calories, and cities built more for car travel than for physical activity.
Our jobs have become more and more sedentary, with fewer opportunities for non-exercise thermogenesis (NEAT) throughout the day. There’s less time in the school day for recess and physical activity, and fears about neighborhood safety limit kids’ ability to get out and play after the school day is over. Our towns and cities are built more for cars than for walking or biking. We can’t turn back the clock on human progress, and finding a way to stay healthy in obesogenic environments is a significant challenge.
Our environments can also impact our food choices. We’re surrounded by vending machines, fast food restaurants, coffee shops, and convenience stores that offer quick and inexpensive access to calories. These foods are also heavily advertised, and especially when people are stretched thin by working long hours or multiple jobs, they can be a welcome convenience. However, they tend to be calorie-dense (and less nutrient-dense) and more heavily processed, with amounts of sugar, fat, and salt optimized to make us want to eat more, compared with home-cooked food. In addition, portions, especially fast food chain restaurants, have increased over the decades, and people are eating at restaurants more and cooking at home less.
Poverty and Food Insecurity
Living in poverty usually means living in a more obesogenic environment. Consider the fact that some of the poorest neighborhoods in the United States—with some of the highest rates of obesity—are often not safe or pleasant places to walk, play, or exercise. They may have heavy traffic and polluted air. They may lack sidewalks, green spaces, and playgrounds. A person living in this type of neighborhood will find it much more challenging to get adequate physical activity compared with someone living in a neighborhood where it’s safe to walk to school or work, play at a park, ride a bike, or go for a run.
In addition, poor neighborhoods often lack a grocery store where people can purchase fresh fruits and vegetables and the basic ingredients necessary for cooking at home. Such areas are called “food deserts”—where healthy foods simply aren’t available or easily accessible.
Another concept useful in discussions of obesity risk is “food insecurity.” Food security means “access by all people at all times to enough food for an active, healthy life.”8 Food insecurity means an inability to consistently obtain adequate food. It may seem counter-intuitive, but in the United States, food insecurity is linked to obesity. That is, people who have difficulty obtaining enough food are more likely to become obese and suffer from diabetes and hypertension. This is likely related to the fact that inexpensive foods tend to be high in calories but low in nutrients. When these foods form the foundation of a person’s diet, they can cause both obesity and nutrient deficiencies. It’s estimated that 12 percent of U.S. households are food insecure, and food insecurity is higher among Black (22 percent) and Latino (18 percent) households.3
Genetics And Weight Status
What about genetics? While it’s true that our genes can influence our susceptibility to becoming obese, researchers say they can’t be a cause of the obesity epidemic. Genes take many generations to evolve, and the obesity epidemic has occurred over just the last 40 to 50 years—only a few generations. When our grandparents were children, they were much less likely to become obese than our own children. That’s not because their genes were different, but rather because they grew up in a different environment. However, it is true that a person’s genes can influence their susceptibility to becoming obese in this obesogenic environment, and obesity is more prevalent in some families. A person’s genetic make-up can make it more difficult to maintain energy balance in an obesogenic environment, because certain genes may make you feel more hungry or slow your energy expenditure.2
Solutions to the Obesity Epidemic
Given the multiple causes of obesity, solving this problem will also require many solutions at different levels. Because obesity affects people over the lifespan and is difficult to reverse, many of these efforts focus on prevention, starting as early as the first year of life. We’ll discuss individual weight management strategies later in this chapter. Here, we’ll review some strategies happening in schools, communities, and at the state and federal levels.
Support Healthy Dietary Patterns
Interventions that support healthy dietary patterns, especially among people more vulnerable because of food insecurity or poverty, may reduce obesity. In some cases, studies have shown that they have an impact, and in other cases, it’s too soon to know. Here are some examples:
- Implement and support better nutrition standards for childcare, schools, hospitals, and worksites.9
- Limit marketing of processed foods, especially ads targeted towards children.
- Provide supermarkets and farmers’ markets incentives to establish businesses in underserved areas.
- Place nutrition and calorie content on menus to raise awareness of food choices
- Improve the nutritional quality of foods provided through assistance programs.
- Tax sugary drinks, such as soda, sports drinks, and fruit punch.
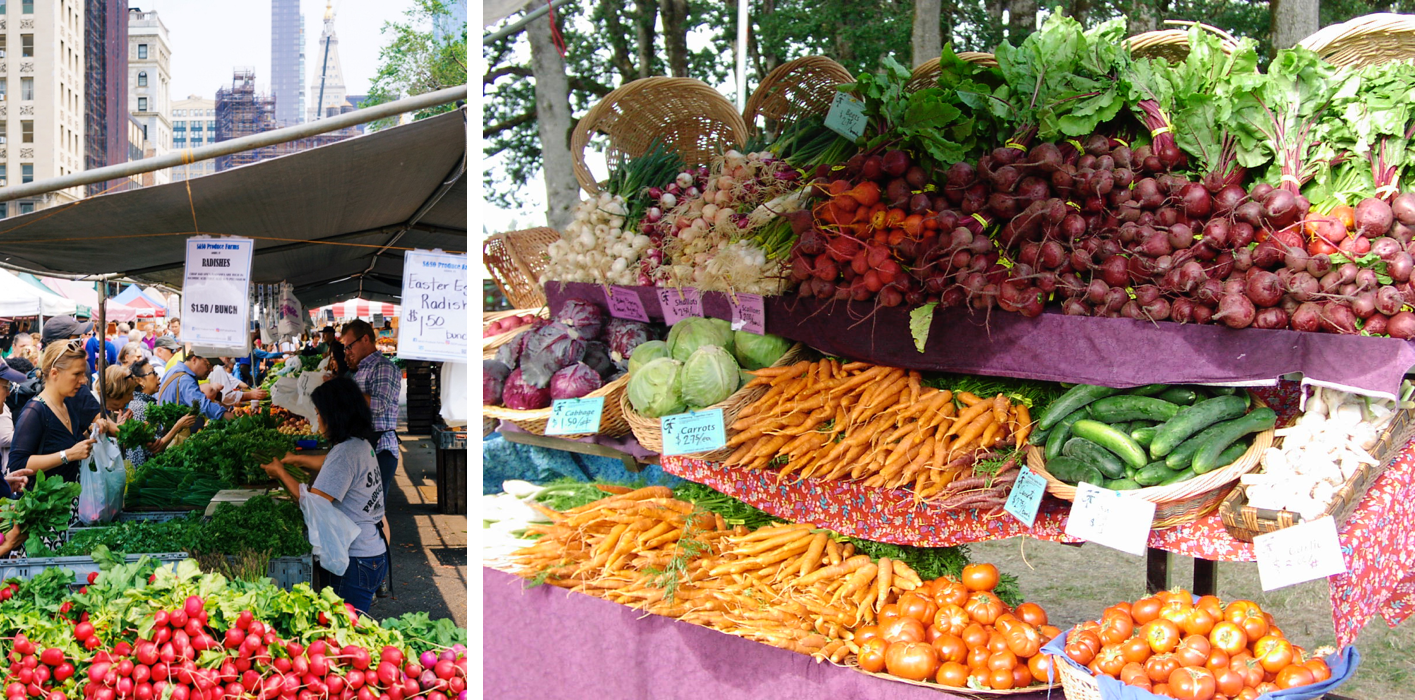
Figure 7.20. Farmers’ markets can expand healthy food options for neighborhoods and build connections between consumers and local farmers.
Calories on Menu Labels
Beginning in 2018, as part of the Affordable Care Act, chain restaurants with more than 20 locations were required to add calorie information to their menus. There isn’t enough research to say whether having this information improves customers’ choices; some studies show an effect and others don’t.10 Many factors influence people’s decisions, and the type of restaurant, customer needs, and menu presentation all likely matter. For example, some studies show that health-conscious consumers choose lower-calorie menu items when presented with nutrition information. Still people with food insecurity may understandably choose higher calorie items to get more “bang for their buck”.11
Research has also shown that adding interpretative images—like a stoplight image labeling menu choices as green or red as shorthand for high or low nutrient density—can help. And a 2018 study found that when calorie counts are on the left side of English-language menus, people order lower-calorie menu items. Putting calorie counts on the right side of the menu (as is more common) doesn’t have this effect, likely because the English language is read from left to right.12 Some studies have also found that restaurants that implement menu labeling offer lower-calorie and more nutrient-dense options, indicating that menu labeling may push restaurants to look more closely at the food they serve.10,13

Figure 7.21. As of 2018, restaurant chains and some other food vendors are required to list calorie counts on their menus. Would these make you pause before ordering?
Healthy Assistance Program Foods
In 2009, USDA revised the food packages for the Women, Infants, and Children (WIC) program to align with the Dietary Guidelines for Americans. The new packages emphasize more fruits, vegetables, whole grains, and low-fat dairy and decreased the availability of juice. After this change, obesity rates of children in the WIC program decreased. The Supplemental Nutrition Assistance Program (SNAP) currently has no guidelines for the nutrient content of foods recipients can purchase. Therefore, SNAP funds can be spent on any to purchase any foods. Fortunately, many farmers’ markets now accept SNAP benefits for the purchase of fresh fruit and vegetables.3
Sugar Taxes
Soda, fruit punch, and sports drinks are loaded with added sugar. This sugar contributes significant empty calories to the U.S. diet and are associated with childhood obesity. Local taxes on soda and other sugary drinks are often controversial, and soda companies lobby to prevent them from passing. However, early research in U.S. cities with soda taxes shows that they do work to decrease soda consumption.3 The United Kingdom has taken a different approach. They started taxing soft drink manufacturers for the sugar content of the products they sell. Between 2015 and 2018, the average sugar content of soda sold in the U.K. dropped by 29 percent.14
Support Physical Activity
Increasing physical activity increases the energy expended during the day. This can help maintain energy balance, thus preventing weight gain. It may also help to shift a person into negative energy balance and facilitate weight loss if needed. But simply adding an exercise session—a run or a trip to the gym, say—often doesn’t shift energy balance (though it’s undoubtedly good for health). Why? Exercise can increase hunger, and there’s only so many calories a person can burn in 30 or 60 minutes. That’s why it’s also important to look for opportunities for non-exercise activity thermogenesis (NEAT); that is, find ways to increase movement throughout the day.
- Schools should have physical education classes and recess. In addition to helping kids stay healthy, movement also helps them learn.
- Make neighborhoods safer and more accessible for walking, cycling, and playing.
- When safe, encourage kids to walk or bike to school.
- Build family and community activities around physical activity, such as trips to the park, walks together, and community walking and exercise groups.
- Facilitate more movement in the workday by encouraging walking meetings, movement breaks, and treadmill desks.
- Find ways to move that are enjoyable to you and fit your life. Yard work, walking your dog, playing tag with your kids, and going out dancing all count!
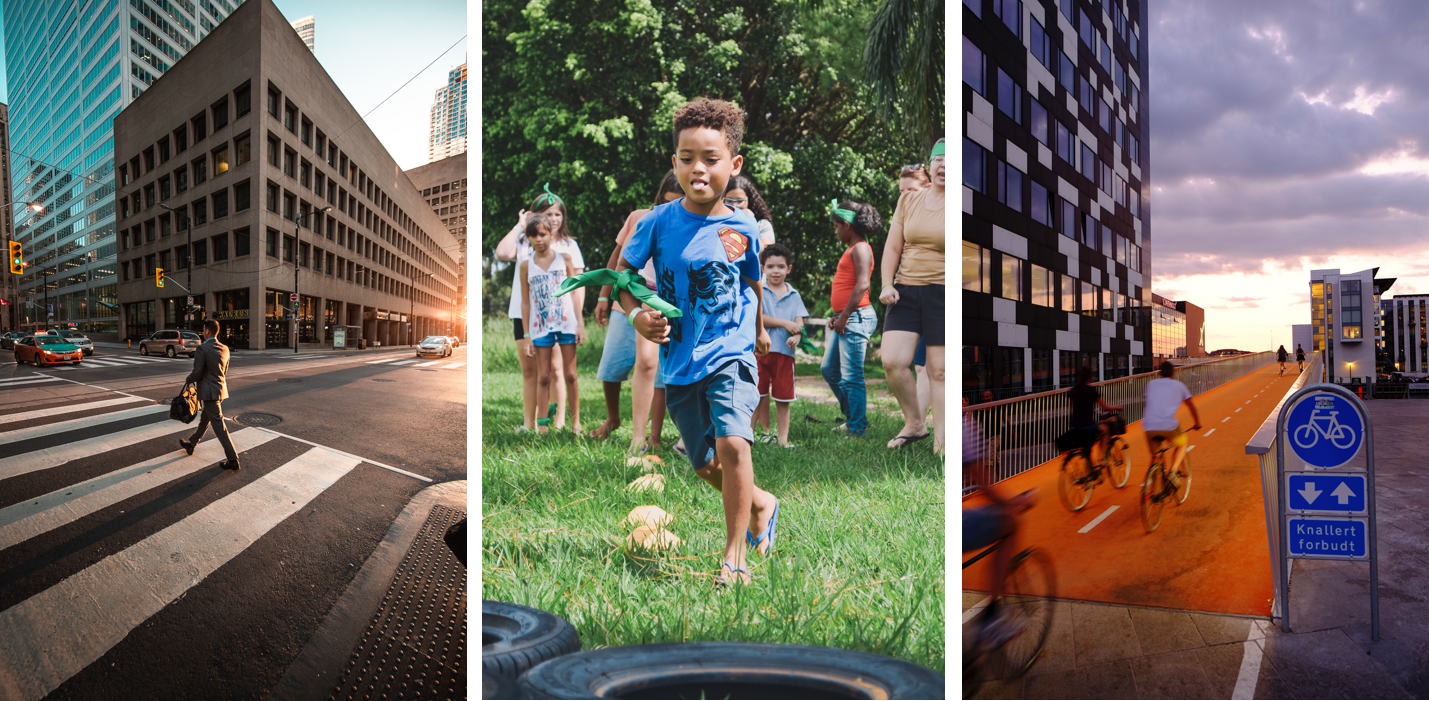
Figure 7.22. There are lots of ways to increase physical activity, including walking to work, playing with friends, and going for a bike ride.
VIDEO: “James Levine: ‘I Came Alive as a Person’“ by NOVA’s Secret Life of Scientists and Engineers, YouTube (April 24, 2014), 3:04 minutes. This short video explains some of the research on NEAT and efforts to increase it in our lives.
VIDEO: “The Weight of the Nation: Poverty and Obesity” by HBO Docs, YouTube (May 14, 2012), 24:05 minutes.
VIDEO: “The Weight of the Nation: Healthy Foods and Obesity Prevention” by HBO Docs, YouTube (May 14, 2012), 31:11 minutes. These segments from the HBO documentary series, “The Weight of the Nation,” explore some of the causes and potential solutions for obesity.
Review Questions
References:
- 1CDC. (2019, September 12). New Adult Obesity Maps. Retrieved October 30, 2019, from Centers for Disease Control and Prevention website: https://www.cdc.gov/obesity/data/prevalence-maps.html
- 2CDC. (2019, January 31). Adult Obesity Facts | Overweight & Obesity | CDC. Retrieved October 30, 2019, from https://www.cdc.gov/obesity/data/adult.html
- 3Trust for America’s Health. (2019). The State of Obesity: Better Policies for a Healthier America. Retrieved from https://www.tfah.org/report-details/stateofobesity2019/
- 4Swinburn, B. A., Kraak, V. I., Allender, S., Atkins, V. J., Baker, P. I., Bogard, J. R., … Dietz, W. H. (2019). The Global Syndemic of Obesity, Undernutrition, and Climate Change: The Lancet Commission report.
The Lancet, 393(10173), 791–846. https://doi.org/10.1016/S0140-6736(18)32822-8
- 5UNICEF. (2019). The State of the World’s Children 2019. Children, Food and Nutrition: Growing well in a changing world. New York.
- 6Jaacks, L. M., Vandevijvere, S., Pan, A., McGowan, C. J., Wallace, C., Imamura, F., … Ezzati, M. (2019). The obesity transition: Stages of the global epidemic. The Lancet Diabetes & Endocrinology, 7(3), 231–240. https://doi.org/10.1016/S2213-8587(19)30026-9
- 7Townshend, T., & Lake, A. (2017). Obesogenic environments: Current evidence of the built and food environments. Perspectives in Public Health, 137(1), 38–44. https://doi.org/10.1177/1757913916679860
- 8Pan, L., Sherry, B., Njai, R., & Blanck, H. M. (2012). Food Insecurity Is Associated with Obesity among US Adults in 12 States. Journal of the Academy of Nutrition and Dietetics, 112(9), 1403–1409. https://doi.org/10.1016/j.jand.2012.06.011
- 9CDC. (2019, June 18). Community Efforts | Overweight & Obesity | CDC. Retrieved October 30, 2019, from https://www.cdc.gov/obesity/strategies/community.html
- 10Bleich, S. N., Economos, C. D., Spiker, M. L., Vercammen, K. A., VanEpps, E. M., Block, J. P., … Roberto, C. A. (2017). A Systematic Review of Calorie Labeling and Modified Calorie Labeling Interventions: Impact on Consumer and Restaurant Behavior.
Obesity (Silver Spring, Md.), 25(12), 2018–2044. https://doi.org/10.1002/oby.21940
- 11Berry, C., Burton, S., Howlett, E., & Newman, C. L. (2019). Understanding the Calorie Labeling Paradox in Chain Restaurants: Why Menu Calorie Labeling Alone May Not Affect Average Calories Ordered.
Journal of Public Policy & Marketing, 38(2), 192–213. https://doi.org/10.1177/0743915619827013
- 12Dallas, S. K., Liu, P. J., & Ubel, P. A. (2019). Don’t Count Calorie Labeling Out: Calorie Counts on the Left Side of Menu Items Lead to Lower Calorie Food Choices. Journal of Consumer Psychology, 29(1), 60–69.
https://doi.org/10.1002/jcpy.1053
- 13Theis, D. R. Z., & Adams, J. (2019). Differences in energy and nutritional content of menu items served by popular UK chain restaurants with versus without voluntary menu labelling: A cross-sectional study.
PLOS ONE, 14(10), e0222773. https://doi.org/10.1371/journal.pone.0222773
- 14Public Health England. (2019). Sugar reduction: Report on progress between 2015 and 2018. Retrieved from https://assets.publishing.service.gov.uk/government/uploads/system/uploads/attachment_data/file/832182/Sugar_reduction__Yr2_progress_report.pdf
An environment that promotes increased food intake, non-healthful foods, and physical inactivity
Have a BMI between 25 up to 30, or weighing about 25 lbs more than is desirable.
WHO considers it as an "abnormal or excessive fat accumulation that may impair health." Having a BMI over 30. Most people weigh 50 pounds or more than is desirable.
Having a BMI greater than 40 or weighing 100 pounds more than the ideal body weight.
National Health and Nutrition Survey. A large scale surveillance survey conducted every few years by CDC.
Non-exercise activity thermogenesis, are the calories burned by the movements we make during normal living. NEAT includes the physical movement in our lives that isn't planned exercise or sports such walking to class, cleaning house, or shopping.
