Unit 8 – Vitamins and Minerals Part 1
8.5 Vitamins and Minerals Involved In Fluid And Electrolyte Balance
- The earth’s surface is 70% water, and human beings are mostly water, ranging from about 75% of body mass in infants, 50–60% in adults, and as low as 45% in old age. (The percent of body water changes with development because the proportions of muscle, fat, bone, and other tissues change from infancy to adulthood.) Of all the nutrients, water is the most critical, as its absence proves lethal within a few days. The importance of water in the human body can be loosely categorized into four basic functions: transportation vehicle, medium for chemical reactions, lubricant/shock absorber, and temperature regulator.
Maintaining the right level of water in your body is crucial to survival, as either too little or too much will result in less-than-optimal functioning. Although water makes up the largest percentage of body volume, it is not actually pure water, but rather a mixture of dissolved substances (solutes) that are critical to life. These solutes include electrolytes, such as potassium (K+), sodium Na+) and chloride (Cl+). Together, these electrolytes are involved in many body functions.
Sodium
Although sodium often gets vilianized because of its link to hypertension, it is an essential nutrient that is vital for survival. As previously discussed, it is not only important for fluid balance, but also nerve impulse transmission and muscle contraction.
Food Sources of Sodium
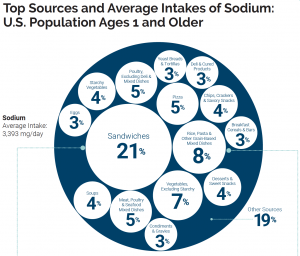
Sodium can be found naturally in a variety of whole foods, but most sodium in the typical American diet comes from processed and prepared foods. Manufacturers add salt to foods to improve texture and flavor, and also to act as a preservative. Even foods that you wouldn’t consider to be salty, like breakfasts cereals, can have greater than 10% of the DV for sodium. Most Americans exceed the adequate intake recommendation of 1500 mg per day, averaging 3,393 mg per day.1 The sources of sodium in the American diet are shown below.

Figure 8.6. Top sources and average intake of sodium in the U.S. population, ages 1 year and older.6
This slideshow from WebMD, “Sources of Salt and How to Cut Back,” offers some tools for reducing dietary sodium.
Sodium Deficiency and Toxicity
Deficiencies of sodium are extremely rare since sodium is so prevalent in the American diet. It is too much sodium that is the main concern. High dietary intake of sodium is one risk factor for hypertension, or high blood pressure. In many people with hypertension, cutting salt intake can help reduce their blood pressure. However, studies have shown that this isn’t always the case. According to Harvard Medical School, “About 60% of people with high blood pressure are thought to be salt-sensitive — [a trait that means your blood pressure increases with a high-sodium diet]. So are about a quarter of people with normal blood pressure, although they may develop high blood pressure later, since salt sensitivity increases with age and weight gain.”2 Genetics, race, sex, weight, and physical activity level are determinants of salt sensitivity. African Americans, women, and overweight individuals are more salt-sensitive than others.
The Dietary Approaches to Stop Hypertension (DASH) is an eating pattern that has been tested in randomized controlled trials and shown to reduce blood pressure and LDL cholesterol levels, resulting in decreased cardiovascular disease risk. The DASH plan recommends focusing on eating vegetables, fruits, and whole grains, as well as including fat-free or low-fat dairy products, fish, poultry, beans, nuts, and vegetable oils; together, these foods provide a diet rich in key nutrients, including potassium, calcium, magnesium, fiber, and protein. DASH also recommends limiting foods high in saturated fat (e.g., fatty meats, full-fat dairy products, and tropical oils such as coconut or palm oils), sugar-sweetened beverages, and sweets. DASH also suggests consuming no more than 2,300 mg of sodium per day and notes that reduction to 1,500 mg of sodium per day has been shown to further lower blood pressure.1
Although the updated dietary reference intake (DRI) for sodium does not include an upper intake level (UL), the updated adequate intake (AI) considers chronic disease risk.3 There is a high strength of evidence that reducing sodium intake reduces blood pressure and therefore reduces cardiovascular disease risk.4
Potassium
Potassium is present in all body tissues and is the most abundant positively charged electrolyte in the intracellular fluid. As discussed previously, it is required for proper fluid balance, nerve transmission, and muscle contraction.5
Food Sources of Potassium
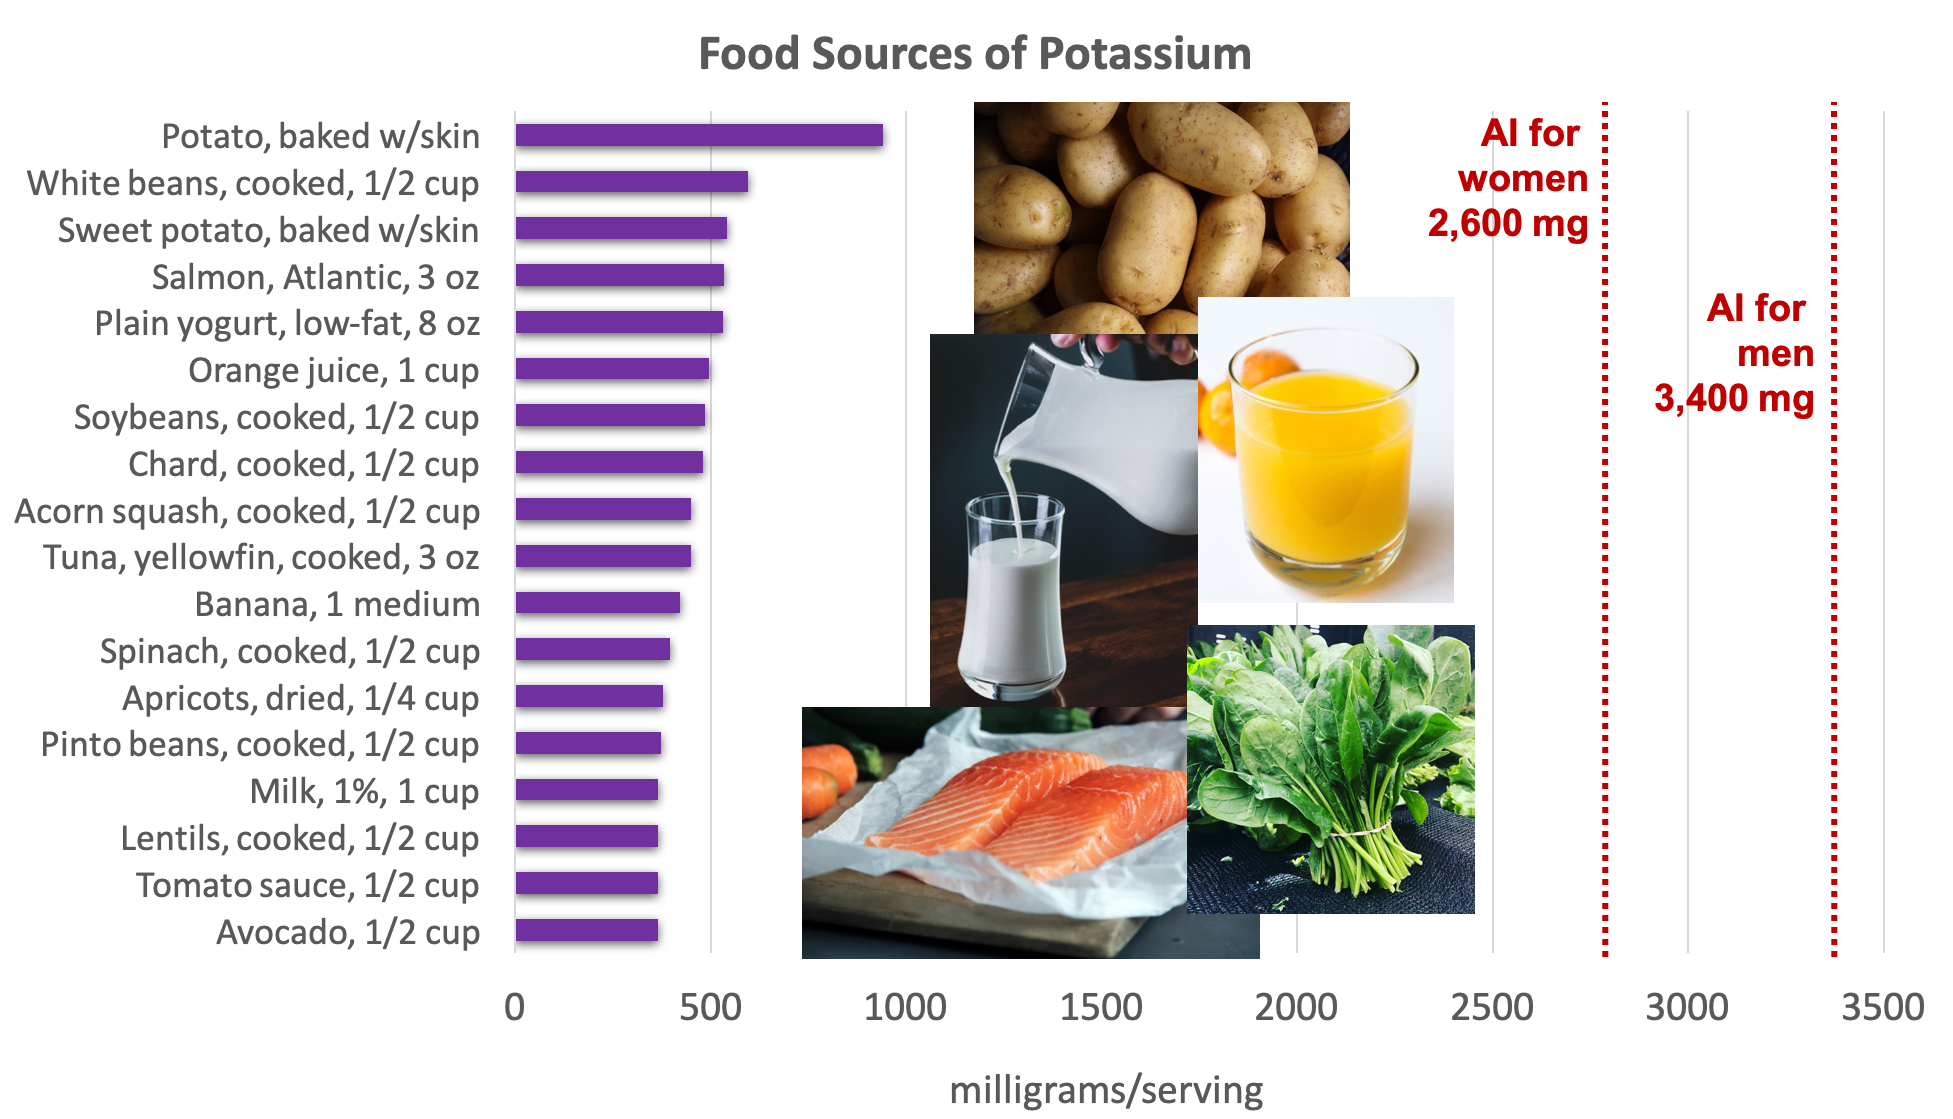
Potassium is found in a wide variety of fresh plant and animal foods. Fresh fruits and vegetables are excellent sources of potassium, as well as dairy products (e.g., milk and yogurt), beans (e.g., lentils and soybeans), and meat (e.g., salmon and beef).5

Figure 8.7. Dietary sources of potassium. Source: Dietary Guidelines for Americans, 2015-2020
The 2020-2025 Dietary Guidelines for Americans identifies potassium as a “dietary component of public health concern,” because dietary surveys consistently show that people in the United States consume less potassium than is recommended. Most supplements contain no more than 99 mg per serving , while adults need between 2600 to 3400 milligrams each day.5,6 This is a nutritional gap that must be corrected through food since most dietary supplements do not contain significant amounts of potassium.
Potassium Deficiency and Toxicity
Low potassium intake may have negative health implications on blood pressure, kidney stone formation, bone mineral density, and type 2 diabetes risk. Although there is a large body of evidence that has found a low potassium intake increases the risk of hypertension, especially when combined with high sodium intake, and higher potassium intake may help decrease blood pressure, especially in salt-sensitive individuals, the body of evidence to support a cause-and-effect relationship is limited and inconclusive.7 However, it is important to remember that a lack of evidence does not mean there is a lack of effect of potassium intake on chronic disease outcomes. This is an area that needs more research to determine the effect dietary potassium has on chronic disease risk.
There is no UL set for potassium since healthy people with normal kidney function can excrete excess potassium in the urine, and therefore high dietary intakes of potassium do not pose a health risk.7 However, the absence of a UL does not mean that there is no risk from excessive supplemental potassium intake, and caution is warranted against taking high levels of supplemental potassium.8
Chloride
Chloride helps with fluid balance, acid-base balance, and nerve cell transmission. It is also a component of hydrochloric acid, which aids digestion in the stomach.9
Table salt is 60% chloride, so most chloride in the diet comes from salt. Each teaspoon of salt contains 3.4 grams of chloride. The chloride AI for adults is 2.3 grams. Therefore, the chloride requirement can be met with less than a teaspoon of salt each day. Other dietary sources of chloride include tomatoes, lettuce, olives, celery, rye, whole-grain foods, and seafood.
Chloride deficiency is rare since most foods containing sodium also provide chloride, and sodium intake in the American diet is high.9
Self Review Questions
Attributions
- Lane Community College’s Nutrition: Science and Everyday Application CC BY-NC.4
- Zimmerman, M., & Snow, B. Nutrients Important to Fluid and Electrolyte Balance. In An Introduction to Nutrition (v. 1.0). https://2012books.lardbucket.org/books/an-introduction-to-nutrition/index.html, CC BY-NC-SA 3.0
- “Fluid, Electrolyte, and Acid-Base Balance,” unit 26 from J. Gordon Betts, Kelly A. Young, James A. Wise, Eddie Johnson, Brandon Poe, Dean H. Kruse, Oksana Korol, Jody E. Johnson, Mark Womble, Peter DeSaix, Anatomy and Physiology, CC BY 4.0
- “Structure and Composition of the Cell Membrane,” unit 3.1 from J. Gordon Betts, Kelly A. Young, James A. Wise, Eddie Johnson, Brandon Poe, Dean H. Kruse, Oksana Korol, Jody E. Johnson, Mark Womble, Peter DeSaix, Anatomy and Physiology, CC BY 4.0
References:
- 1National Heart, Lung, and Blood Institute. DASH Eating Plan. Retrieved February 9, 2021, from https://www.nhlbi.nih.gov/health-topics/dash-eating-plan
- 2Harvard Health Publishing. (August 2019). Salt Sensitivity: Sorting out the science. Retrieved from https://www.health.harvard.edu/heart-health/salt-sensitivity-sorting-out-the-science
- 3The National Academies of Sciences, Engineering and Medicine. Dietary Reference Intakes for Sodium and Potassium. (2019). Chapter 14 – Sodium: Dietary Reference Intakes for Toxicity. Retrieved from https://www.nap.edu/read/25353/chapter/14
- 4The National Academies of Sciences, Engineering and Medicine. Dietary Reference Intakes for Sodium and Potassium. (2019). Chapter 13 – Sodium: Dietary Reference Intakes for Adequacy. Retrieved from https://www.nap.edu/read/25353/chapter/13
- 5National Institutes of Health of Dietary Supplements. Potassium – Health Professional Fact Sheet. Retrieved April 6, 2020 from https://ods.od.nih.gov/factsheets/Potassium-HealthProfessional/
- 6U.S. Department of Agriculture and U.S. Department of Health and Human Services. (2020). Dietary Guidelines for Americans, 2020-2025, 9th Edition. Retrieved from https://www.dietaryguidelines.gov/
- 7The National Academies of Sciences, Engineering and Medicine. Dietary Reference Intakes for Sodium and Potassium. (2019). Chapter 10 – Potassium: Dietary Reference Intakes Based on Chronic Disease. Retrieved from https://www.nap.edu/read/25353/chapter/10
- 8The National Academies of Sciences, Engineering and Medicine. Dietary Reference Intakes for Sodium and Potassium. (2019). Chapter 9 – Potassium: Dietary Reference Intakes for Toxicity. Retrieved from https://www.nap.edu/read/25353/chapter/9
- 9The National Academies of Sciences, Engineering and Medicine. Dietary Reference Intakes for Water, Potassium, Sodium Chloride and Sulfate. (2005). Chapter 6 – Sodium and Chloride. Retrieved from https://www.nap.edu/read/10925/chapter/8#272
Images:
- Figure 8.6. “Top Sources and Average Intakes of Sodium: U.S. Population Ages 1 and Older” from Dietary Guidelines for Americans, 2020-2025, Figure 1-12 is in the Public Domain
- Figure 8.7. “Food sources of potassium” by Alice Callahan is licensed under CC BY 4.0, with images from top to bottom by Lars Blankers, Greg Rosenke, Eliv-Sonas Aceron, Elianna Friedman, and Caroline Attwood, all on Unsplash (license information)

