Unit 2 – Planning Healthy Diets
2.6 Tools for Achieving a Healthy Diet
Good nutrition means eating the right foods, in the right amounts, to receive enough (but not too much) of the essential nutrients so that the body can remain free from disease, grow properly, work effectively, and feel its best. The phrase “you are what you eat” refers to the fact that the food you eat has cumulative effects on the body. And many of the nutrients obtained from food do become a part of us. For example, the protein and calcium found in milk can be used in the formation of bone. The foods we eat also impact how we feel—both today and in the future. Below we will discuss the key components of a healthy diet that will help prevent chronic disease (like heart disease and diabetes), maintain a healthy weight, and promote overall health.
Components of a Healthy Diet
Achieving a healthy diet is a matter of balancing the quality and quantity of food that you eat to provide an appropriate combination of energy and nutrients. There are four key characteristics that make up a healthful diet:
- Adequacy
- Balance
- Moderation
- Variety
1. Adequacy
A diet is adequate when it provides sufficient amounts of calories and each essential nutrient, as well as fiber. Most Americans report not getting enough fruit, vegetables, whole grains or dairy, which may mean falling short in the essential vitamins and minerals found in these food groups, like Vitamin C, potassium, and calcium, as well as fiber.1
2. Balance
A balanced diet means eating a combination of foods from the different food groups, and because these food groups provide different nutrients, a balanced diet is likely to be adequate in nutrients. For example, vegetables are an important source of potassium, dietary fiber, folate, vitamin A, and vitamin C, whereas grains provide B vitamins (thiamin, riboflavin, niacin, and folate) and minerals (iron, magnesium, and selenium). No one food is more important than the other. It is the combination of all the different food groups (fruit, vegetables, grains, dairy, protein and fats/oils) that will ensure an adequate diet.

3, Moderation
Moderation means not eating to the extremes, neither too much nor too little of any one food or nutrient. Moderation means that small portions of higher-calorie, lower-nutrient foods like chips and candy can fit within a healthy diet. Including these types of foods can make healthy eating more enjoyable and also more sustainable. When eating becomes too extreme—where many foods are forbidden—this eating pattern is often short-lived until forbidden foods are overeaten. Too many food rules can lead to a cycle of restriction-deprivation-overeating-guilt.2 For sustainable, long-term health benefits, it is important to give yourself permission to eat all foods.

4. Variety
Variety refers to consuming different foods within each of the food groups on a regular basis. Eating a varied diet helps to ensure that you consume adequate amounts of all essential nutrients required for health. One of the major drawbacks of a monotonous diet is the risk of consuming too much of some nutrients and not enough of others. Trying new foods can also be a source of pleasure—you never know what foods you might like until you try them.
Dietary Guidelines for Americans
The Dietary Guidelines serve as a guide to healthy eating for American and are published and revised every five years jointly by the U.S. Department of Agriculture (USDA) and Health and Human Services (HHS).3 Their purpose is to give Americans evidence-based information on what to eat and drink to promote health and prevent chronic disease. Public health agencies, health care providers, and educational institutions all rely on Dietary Guidelines recommendations and strategies.3 These agencies use the Dietary Guidelines to:
- Form the basis of federal nutrition policy and programs such as WIC and SNAP
- Help guide local, state, and national health promotion and disease prevention initiatives
- Inform various organizations and industries (for example, products developed and marketed by the food and beverage industry)
Process
Before HHS and the USDA release the new Dietary Guidelines, they assemble an Advisory Committee. This committee is composed of nationally recognized nutrition and medical researchers, academics, and practitioners. The Advisory Committee develops an Advisory Report that synthesizes current scientific and medical evidence in nutrition, which will then advise the federal government in the development of the new edition of the Dietary Guidelines.
The public also has opportunities to get involved in the development of these guidelines. The Advisory Committee holds a series of public meetings for hearing oral comments from the public, and the public also has opportunities to provide written comments to the Advisory Committee throughout the course of its work. After the Advisory Report is complete, the public has opportunities to respond with written comments and provide oral testimony at a public meeting.
2020-2025 Dietary Guidelines
The major topic areas of the current Dietary Guidelines are:
- Follow a healthy dietary pattern at every life stage.
- Customize and enjoy nutrient-dense food and beverage choices to reflect personal preferences, cultural traditions, and budgetary considerations.
- Focus on meeting food group needs with nutrient-dense foods and beverages, and stay within calorie limits.
- Limit foods and beverages higher in added sugars, saturated fat, and sodium, and limit alcoholic beverages.

Several nutrients are of special public health concern, including dietary fiber, calcium, potassium, and vitamin D. Inadequate intake of these nutrients is common among Americans and is associated with greater risk of chronic disease. People can increase their intake of these nutrients by shifting towards eating more vegetables, fruits, whole grains, dairy products, and beans. The Dietary Guidelines thus encourage the following nutrient-dense food choices:
- Vegetables, including a variety of dark green, red and orange, legumes (beans and peas), starchy and other vegetables
- Fruits, especially whole fruits
- Grains, at least half of which are whole grains
- Dairy, including fat-free or low-fat milk, yogurt, and cheese, and/or fortified soy beverages and yogurt
- Protein foods, including seafood (8 or more ounces per week), lean meats and poultry, eggs, legumes (beans, peas, lentils), soy products, and nuts and seeds
- Oils, including those from plants, such as canola, corn, olive, peanut, safflower, soybean, and sunflower oils, and those present in whole foods such as nuts, seeds, seafood, olives, and avocados.
The DGA explains that most of an individual’s daily caloric intake—about 85%—must be made up of nutrient-dense foods in order to meet nutrient requirements, leaving 15% of calories for sugary and/or fatty foods. Many people also consume excessive amounts of sodium and alcohol. Too much of these dietary components is associated with development of chronic disease over time and can add calories without providing much in the way of beneficial nutrients. Therefore, the DGA recommends limiting the following:
- Added sugars – Consume less than 10 percent of calories per day from added sugars starting at age 2. (Avoid foods and beverages with added sugars for those younger than age 2.)
- Saturated fat – Consume less than 10 percent of calories per day from saturated fat starting at age 2.
- Sodium – Consume less than 2,300 milligrams (mg) per day of sodium – and even less for children younger than age 14.
- Alcoholic beverages – If alcohol is consumed, it should be consumed only in moderation (up to one drink per day for women and up to two drinks per day for men). Drinking less is better for health than drinking more.
The United States is not the only country that develops nutritional guidelines. The Food and Agriculture Organization of the United Nations has a website where you can search for dietary guidelines for different countries, such as Sweden’s guidelines, illustrated below.

Figure 2.18. “Sweden’s one-minute advice” by Food and Agriculture Organization of the United Nations (FAO)
The Swedish National Food Agency also has a great resource, “Find Your Way To Eat Greener, Not Too Much and Be Active” on how to put these guidelines into practice.
One way the USDA and other federal agencies implement the Dietary Guidelines is through food guid
USDA Food Guides
For many years, the U.S. government has used food guides as a way of encouraging Americans to develop healthful dietary habits. For example, the food pyramid was introduced in 1992 as the symbol of healthy eating patterns for all Americans.
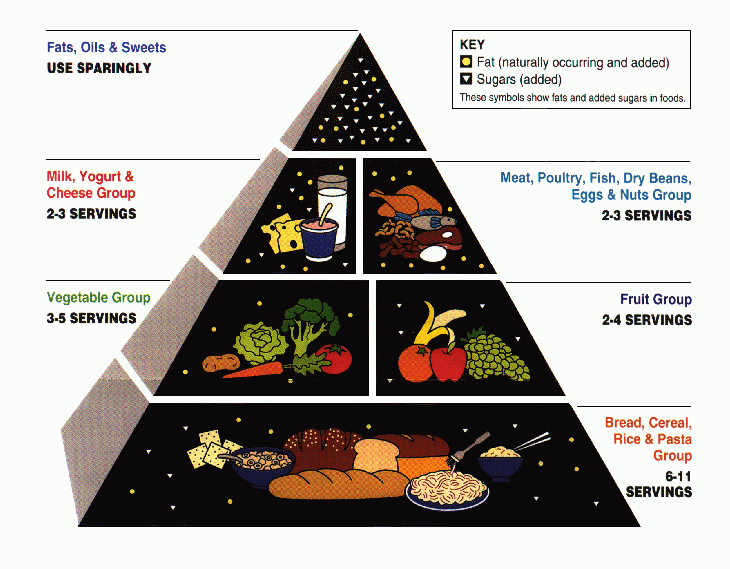
Figure 2.19. The food pyramid, introduced in 1992.
In 2005, the food pyramid was replaced with MyPyramid.
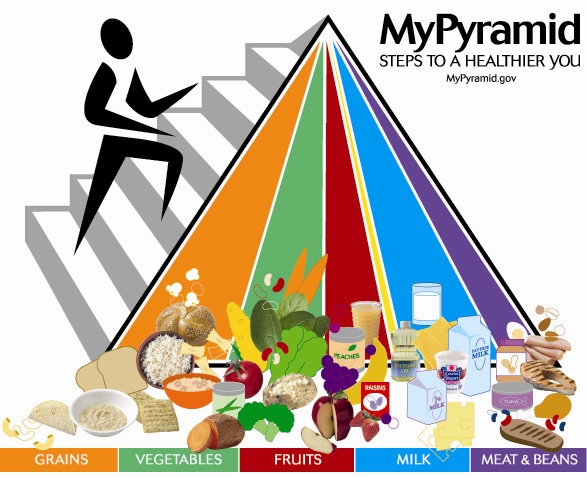
Figure 2.20. MyPyramid, introduced in 2005.
However, many felt this new pyramid was difficult to understand, so in 2011, the pyramid was replaced with MyPlate.
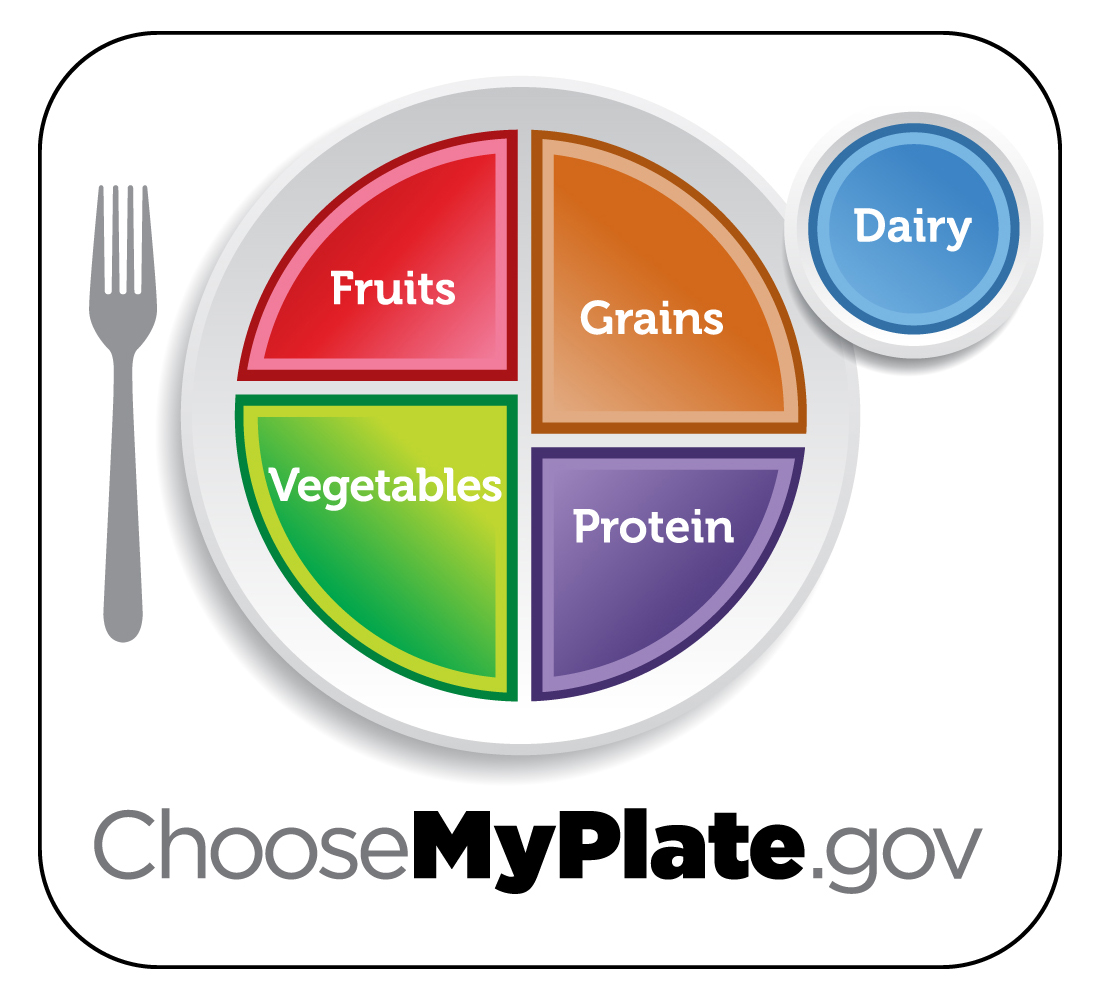
Figure 2.21. MyPlate, introduced in 2011.
MyPlate is a food guide to help Americans achieve the goals of the Dietary Guidelines for Americans. For most people this means eating MORE:
- whole grains
- fruits
- vegetables (especially dark green vegetables and red and orange vegetables)
- legumes
- seafood (to replace some meals of meat and poultry)
- low-fat dairy
And LESS:
- refined grains
- added sugars
- solid fats: saturated fats, trans fats, and cholesterol
- sodium
MyPlate’s 5 Food Groups
Foods are grouped into 5 different groups based on their nutrient content. The following table summarizes the different food groups, examples of foods that fall within each group, and nutrients provided for each food group.
|
Food Group |
Example of Foods |
Nutrients Provided |
|
|
Whole grains: brown rice, oats, whole wheat bread, cereal and pasta, popcorn. Refined grains: typically tortillas, couscous, noodles, naan, pancakes (although sometimes these products can be whole grains too). For more foods and what counts as a cup check out: The Grain Group Food Gallery. |
dietary fiber, several B vitamins (thiamin, riboflavin, niacin, and folate), and minerals (iron, magnesium, and selenium) |
|
|
Dark green vegetables- broccoli, kale, and spinach. Red and orange vegetables- bell peppers, carrots and tomatoes. Starchy vegetables- corn, peas and potatoes. Beans and Peas- hummus, lentils and black beans. Other vegetables- asparagus, avocado, zucchini. For more foods and what counts as a cup check out: The Vegetable Group Food Gallery. |
potassium, dietary fiber, folate, vitamin A, and vitamin C |
|
|
Fresh berries, melons, and other fruit as well as 100% fruit juice. Fruits can also be canned, frozen, or dried, and may be whole, cut-up, or pureed. For more foods and what counts as a cup check out: The Fruit Group Food Gallery. |
potassium, dietary fiber, vitamin C, and folate |
|
|
Meats, poultry, seafood, beans and peas, eggs, nuts and seeds. For more foods and what counts as a cup check out: The Protein Group Food Gallery. |
protein, B vitamins (niacin, thiamin, riboflavin, and B6), vitamin E, iron, zinc, and magnesium |
|
|
Milk, yogurt, cheese and calcium-fortified soy milk. Foods such as cream cheese, cream, and butter, are not part of the Dairy Group as they have little/no calcium (they count as a fat). For more foods and what counts as a cup check out: The Dairy Group Food Gallery. |
calcium, potassium, vitamin D, and protein |
Table 2.4. A summary of MyPlate food groups, examples of foods that fall within each group, and nutrients provided for each food group.
This graphic summarizes serving sizes for each of the 5 food groups:

Figure 2.22. Cup- and ounce-equivalents for different food groups within MyPlate.
Based on MyPlate recommendations, a portion of meat for acults is about 4 ounces. The CDC graphic below shows the average hamburger in the 1950s was 3.9 ounces and increased to 12 ounces in 2006. At this rate, what will the portion in 2050 be? (And what will this do to our health?)
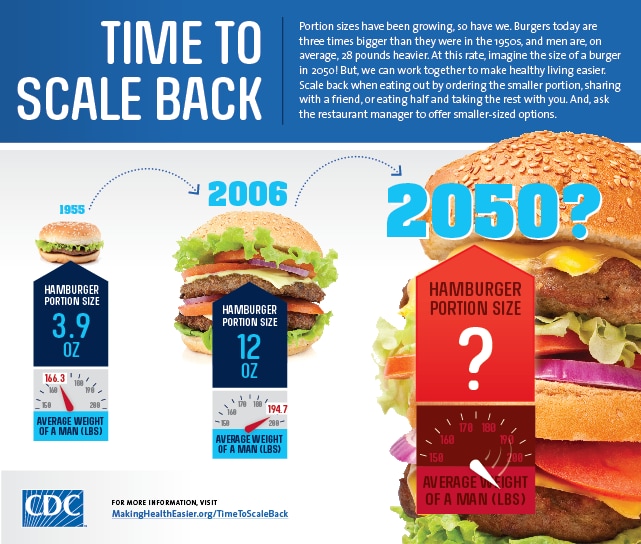
Figure 2.23. Increases in size of hamburgers from 1950 to 2006 with projections to 2050
Planning a healthy diet using the MyPlate approach is not difficult:
- Fill half of your plate with a variety of fruits and vegetables, including red, orange, and dark green vegetables and fruits, such as kale, collard greens, tomatoes, sweet potatoes, broccoli, apples, oranges, grapes, bananas, blueberries, and strawberries in main and side dishes. Vary your choices to get the benefit of as many different vegetables and fruits as you can. One hundred percent fruit juice is also an acceptable choice as long as only half your fruit intake is replaced with juice.
- Fill a quarter of your plate with grains. Half of your daily grain intake should be whole grains such as 100 percent whole-grain cereals, breads, crackers, rice, and pasta. Read the ingredients list on food labels carefully to determine if a food is comprised of whole grains. We will discuss how to identify whole grains in more detail in later units.
- Select a variety of protein foods to improve nutrient intake and promote health benefits. Each week, be sure to include a nice array of protein sources in your diet, such as nuts, seeds, beans, legumes, poultry, soy, and seafood. The recommended consumption amount for seafood for adults is two 4-ounce servings per week. When choosing meat, select lean cuts.
What’s on your plate? Are you making every bite count?
Take the quiz to find out and get personalized resources to Start Simple with MyPlate.
- If you enjoy drinking milk or eating dairy products, such as cheese and yogurt, choose low-fat or nonfat products. Low-fat and nonfat products contain the same amount of calcium and other essential nutrients as whole-milk products, but with much less fat and calories. Calcium, an important mineral for your body, is also found in lactose-free dairy products and fortified plant-based beverages, like soy milk. You can also get calcium from vegetables and other fortified foods and beverages.
- Oils are also important in your diet as they contain valuable essential fatty acids. Oils like canola oil also contain more healthful unsaturated fats compared to solid fats like butter. You can also get oils from whole foods like fish, avocados, and unsalted nuts and seeds. Although oils are essential for health, they do contain about 120 calories per tablespoon, so moderation is important.
Some people have criticized the Dietary Guidelines for Americans and MyPlate for being influenced by political and economic interests, as the meat and dairy industries and large food companies have a powerful lobbying presence that may override scientific consensus. When the 2020-2025 Dietary Guidelines were released in December of 2020, for example, they were criticized for failing to address sustainability, climate change, and the potential benefits of eating less meat and processed foods. In addition, although the 2020 Advisory Committee, made up of nutrition science experts, recommended stricter limits on added sugars and alcohol consumption, the final version of the Guidelines ignored these recommendations and stuck with the same advice about sugar and alcohol given in the 2015 version of the Guidelines.4
Another guide for creating healthy, balanced meals comes from Harvard’s School of Public Health. The Healthy Eating Plate (HEP) is based on the best available science and is not influenced by political or commercial pressures from food industry lobbyists
Nutrient Density and Empty Calories
MyPlate encourages people to take a balanced approach and to eat a variety of nutrient-dense, whole foods. To help people control calories and prevent weight gain, the USDA promotes the concept of nutrient density and empty calories. Nutrient density is a measure of the nutrients that we’re usually trying to consume more of—vitamins, minerals, fiber and protein—per calorie of food, coupled with little or no solid fats, added sugars, refined starches, and sodium. For example, in the screenshot below, a 90 percent lean 3-ounce ground beef patty is considered more nutrient-dense than a 75 percent lean patty. In the 90 percent lean patty, for 184 calories you get protein, iron, and other needed nutrients. On the other hand, the 75 percent lean patty has 236 calories, but the extra 52 calories add only solid fats and no other appreciable nutrients.

Figure 2.24. Examples of the calories found in nutrient-dense food choices compared with calories found in less nutrient-dense forms of these foods.
All vegetables, fruits, whole grains, seafood, eggs, beans and peas, unsalted nuts and seeds, fat-free and low-fat dairy products, and lean meats and poultry—when prepared with little or no added solid fats, and sugars—are nutrient-dense foods.
Foods become less nutrient dense when they contain empty calories—calories from solid fats and/or added sugars. Solid fats and added sugars add calories to a food but don’t provide other nutrients. Foods with empty calories have fewer nutrients per calorie; therefore, they are less nutrient dense.
Examples of foods HIGH in empty calories:
- doughnuts, cakes, cookies
- sweetened cereals and yogurt
- sweetened beverages
- high-fat meats
- fried foods
- alcohol
Examples of nutrient-dense foods:
- whole grains like brown rice, whole wheat bread and pasta, barley, and oatmeal
- plain, nonfat milk and yogurt
- beans, nuts, and seeds
- lean meats
- whole, fresh fruits and vegetables
You can choose more nutrient-dense foods by making small modifications to your current eating pattern. Examples include preparing foods with less fat by baking versus frying, purchasing items like cereals and fruits with less added sugar, and focusing on eating foods in their natural state versus adding a lot of extra fat, sugar and sodium.

Figure 2.25. Typical versus nutrient-dense foods.
Keep in mind that empty calories are not always a bad thing. In fact, empty calories can help promote eating more nutrient-dense foods. Adding a little fat and/or sugar to nutrient-dense foods can add flavor, making the food more enjoyable. A teaspoon of sugar in oatmeal, or a teaspoon of butter on steamed veggies is a great way to include empty calories. In these cases, the calories come packaged with other nutrients (since they are added to whole foods), whereas the empty calories in soda come with no other nutrients, only added
Attributions:
- Lane Community College’s Nutrition: Science and Everyday Application “Tools for Achieving a Healthy Diet” CC BY-NC 4.0
References:
- 1U.S. Department of Agriculture and U.S. Department of Health and Human Services. (2020). Dietary Guidelines for Americans, 2020-2025, 9th Edition. Retrieved from https://www.dietaryguidelines.gov/
- 2Rumsey, A. (2018, Janurary 8) Why Eating Fewer Calories Won’t Help You Lose Weight. U.S. News. Retrieved from https://health.usnews.com/health-news/blogs/eat-run/articles/2018-01-08/why-eating-fewer-calories-wont-help-you-lose-weight
- 3Office of Disease Prevention and Health Promotion. (2020). About the Dietary Guidelines. Retrieved from https://health.gov/our-work/food-nutrition/about-dietary-guidelines
- 4Rabin, R. C. (2020, December 29). U.S. Diet Guidelines Sidestep Scientific Advice to Cut Sugar and Alcohol. The New York Times. https://www.nytimes.com/2020/12/29/health/dietary-guidelines-alcohol-sugar.html
- 5Harvard’s School of Public Health, The Nutrition Source. (2019). Healthy Eating Plate vs. USDA’s MyPlate. Retrieved from https://www.hsph.harvard.edu/nutritionsource/healthy-eating-plate-vs-usda-myplate/
Images:
- “Four Days of Bento” by Blairwang is licensed under CC BY 2.0
- “Colours of Health” by Alex Promois is licensed under CC BY-NC 2.0
- “Fresh Berries” by Cookbookman17 is licensed under CC BY 2.0
- Figure 2.18. “Sweden’s one-minute advice” by Food and Agriculture Organization of the United Nations (FAO) is licensed under CC BY 3.0
- Figure 2.19. “The original food pyramid” from the USDA is in the Public Domain
- Figure 2.20. “Mypyramid” from the USDA is in the Public Domain
- Figure 2.21. “MyPlate” from the USDA is in the Public Domain
- “Food Group Buttons” from the USDA is in the Public Domain
- Table 2.4. “MyPlate Summary” by Tamberly Powell is licensed under CC BY-NC-SA 4.0; information in the table is from ChooseMyPlate is in the Public Domain
- Figure 2.22. “Cup- and ounce-equivalents” by the Dietary Guidelines for Americans, Figure 1.1, is in the Public Domain
- “Lentil Quinoa Soup” by Tasha is licensed under CC BY 2.0
- Figure 2.23. “Harvard’s Healthy Eating Guide” Copyright © 2011, Harvard University. Health, www.thenutritionsource.org, and Harvard Health Publications, www.health.harvard.edu.
- Figure 2.24. “Examples of the calories in food choices that are not in nutrient dense forms and the calories in nutrient dense forms of these foods” by The Dietary Guidelines for Americans 2010, Figure 2.2, is in the Public Domain
- Figure 2.25. “Typical versus nutrient-dense foods” by the Dietary Guidelines for Americans, Public Domain
Containing a high amount of vitamins, minerals, and protein compared to calories.
Containing a high amount of vitamins, minerals, and protein compared to calories


