Unit 3 – The Science of Nutrition
3.2 The Scientific Method

What is the Scientific Method?
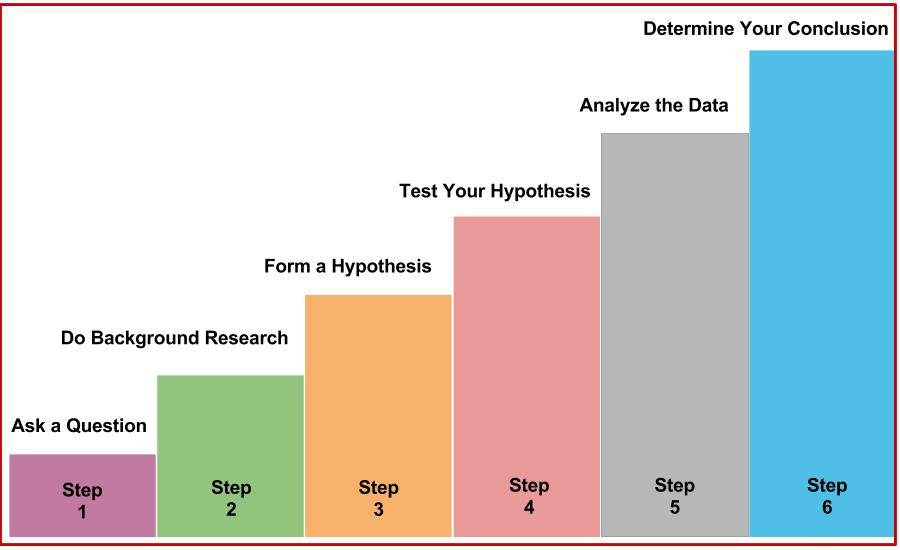
Similar to the method by which a police detective investigates a crime, nutritional scientists discover the health effects of food and nutrients by first making an observation and posing a question that they’d like to answer. Then they formulate a hypothesis, test their hypothesis through experiments, and finally interpret the results. After analyzing additional evidence from multiple sources, they may conclude whether the food suspect fits the claim. This organized process of inquiry used in forensic science, nutritional science, and every other science is called the scientific method.
Figure 3.1 Scientific Method Steps
In 1811, French chemist Bernard Courtois was isolating saltpeter for producing gunpowder to be used by Napoleon’s army. To carry out this isolation, he burned some seaweed and, in the process, observed an intense violet vapor that crystallized when he exposed it to a cold surface. He sent the violet crystals to an expert on gases, Joseph Gay-Lussac, who identified the crystal as a new element. It was named iodine, the Greek word for violet. The following scientific record is some of what took place to conclude that iodine is a nutrient.
Observation. Eating seaweed is a cure for goiter, a gross enlargement of the thyroid gland in the neck.
Hypothesis. In 1813, Swiss physician Jean-Francois Coindet hypothesized that the seaweed contained iodine and that iodine could be used instead of seaweed to treat his patients[1].

Experimental test. Coindet administered iodine tincture orally to his patients with goiter.
Interpret results. Coindet’s iodine treatment was successful.
Hypothesis. French chemist Chatin proposed that the low iodine content in food and water in certain areas far away from the ocean was the primary cause of goiter and renounced the theory that goiter was the result of poor hygiene.
Experimental test. In the late 1860s, the program, “The stamping-out of goiter” started with people in several villages in France being given iodine tablets.
Results. The program was effective, and 80 percent of goitrous children were cured.
Hypothesis. In 1918, Swiss doctor Bayard proposed iodizing salt as an excellent way to treat areas endemic to goiter.
Experimental test. Iodized salt was transported by mules to a small village at the base of the Matterhorn, where more than 75 percent of school children were goitrous. It was given to families to use for six months.
Results. The iodized salt was beneficial in treating goiter in this remote population.
Experimental test. Physician David Marine conducted the first experiment of treating goiter with iodized salt in America in Akron, Ohio.[2]
Results. This study was conducted on over four-thousand schoolchildren, and found that iodized salt prevented goiter.
Conclusions. Seven other studies similar to Marine’s were conducted in Italy and Switzerland, demonstrating the effectiveness of iodized salt in treating goiter. In 1924, US public health officials initiated the program of iodizing salt and started eliminating the scourge of goiter. Today, more than 70% of American households use iodized salt, and many other countries have followed the same public health strategy to reduce the health consequences of iodine deficiency.
VIDEO: “Peer Review in 3 Minutes” by libncsu, YouTube (May 1, 2014), 3:14 minutes
Review Quesitons
Career Connection
What are some of the ways in which you think like a scientist, and use the scientific method in your everyday life? Any decision-making process uses some aspect of the scientific method. Think about some of the major decisions you have made in your life and the research you conducted that supported your decision. For example, what brand of computer do you own? How do you save money? What are your plans after graduation?
Evidence-Based Approach to Nutrition
It took more than one hundred years from iodine’s discovery as an effective treatment for goiter until public health programs recognized it as such. Although a lengthy process, the scientific method is a productive way to define essential nutrients and determine their ability to promote health and prevent disease. The scientific method is part of the overall evidence-based approach to designing nutritional guidelines[3]. An evidence-based approach to nutrition includes[4]:
- Defining the problem or uncertainty (e.g., the incidence of goiter is lower in people who consume seaweed)
- Formulating it as a question (e.g., Does eating seaweed decrease the risk of goiter?)
- Setting criteria for quality evidence
- Evaluating the body of evidence
- Summarizing the body of evidence and making decisions
- Specifying the strength of the supporting evidence required to make decisions
- Disseminating the findings
The Food and Nutrition Board of the Institute of Medicine, a nonprofit, non-governmental organization, constructs its nutrient recommendations (i.e., Dietary Reference Intakes, or DRI) using an evidence-based approach to nutrition. The entire procedure for setting the DRI is documented and made available to the public. The same approach is used by the USDA and HHS, which are departments of the US federal government. The USDA and HHS websites are great tools for discovering ways to optimize health; however, it is important to gather nutrition information from multiple resources, as there are often differences in opinion among various scientists and public health organizations. Full text versions of the DRI publications are available in pdf format at https://www.nap.edu/, along with many other free publications.
Learning Activities
Technology Note: The following activity was created by the University of Hawai‘i at Mānoa Food Science and Human Nutrition Program as an Open Educational Resource (OER) textbook. Throughout this book, we have included several of their colorful and interactive review activities.
Learning activities may be used across various mobile devices, however, for the best user experience it is strongly recommended that users complete these activities using a desktop or laptop computer and in Google Chrome.
- Zimmerman, M.B. (2008). Research on Iodine Deficiency and Goiter in the 19th and Early 20th Centuries. Journal of Nutrition, 138(11), 2060–63. http://jn.nutrition.org/content/138/11/2060.full ↵
- Carpenter, K.J. (2005). David Marine and the Problem of Goiter. Journal of Nutrition, 135(4), 675–80. http://jn.nutrition.org/content/135/4/675.full?sid=d06fdd35-566f -42a2-a3fd- efbe0736b7ba ↵
- Myers E. (2003). Systems for Evaluating Nutrition Research for Nutrition Care Guidelines: Do They Apply to Population Dietary Guidelines? Journal of the American Dietetic Association, 12(2), 34–41. http://jandonline.org/article/S0002-8223(03)01378-6/abstract ↵
- Briss PA, Zara S, et al. (2000). Developing an Evidence-Based Guide to Community Preventive Services—Methods. Am J Prev Med, 18(1S), 35–43. https://www.ncbi.nlm.nih.gov/pubmed/10806978 ↵
The process of objectively establishing facts through testing and experimentation. The basic process involves making an observation, forming a hypothesis, making a prediction, conducting an experiment and finally analyzing the results.
It has been the basis in developing of science since at least the 17th century.
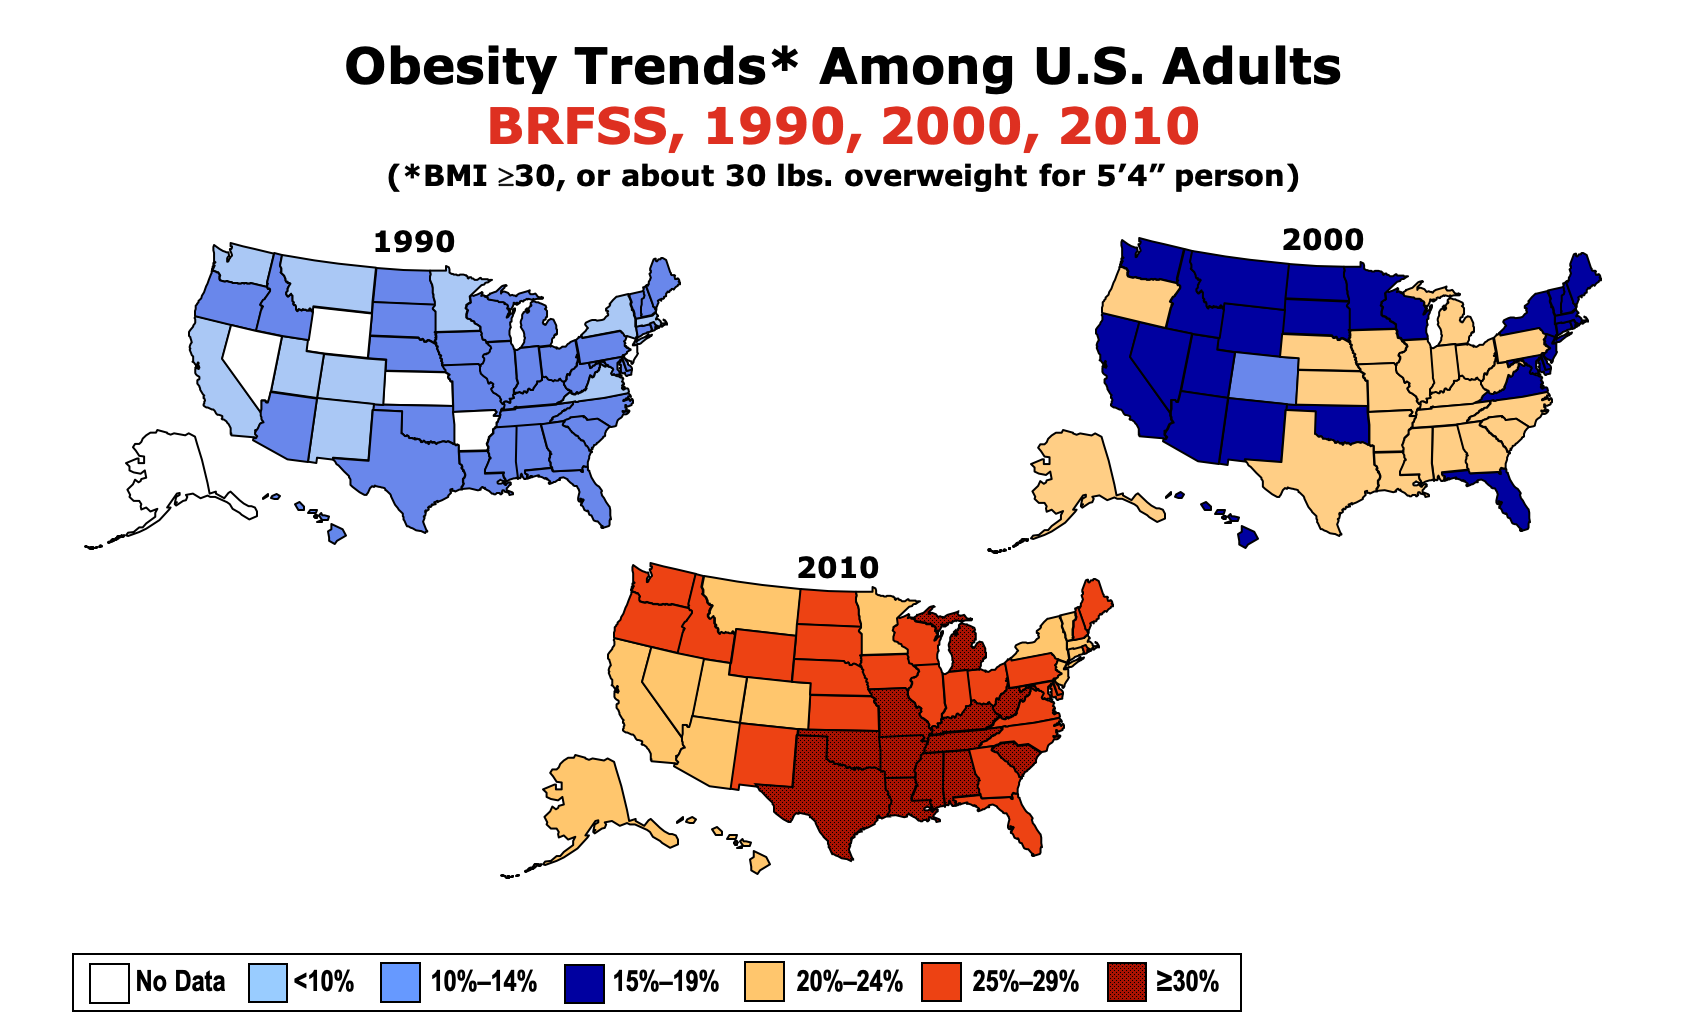
Since the 1980s, the prevalence of obesity in the United States has increased dramatically. Data collected by the Centers for Disease Control and Prevention show rising obesity across the nation, state-by-state.1
Figure 7.17. Each year since 1990, the CDC has published maps of the United States in which states are color-coded based on the percentage of their population estimated to be obese. The maps show a clear increase in the prevalence of obesity between 1990 and 2010.
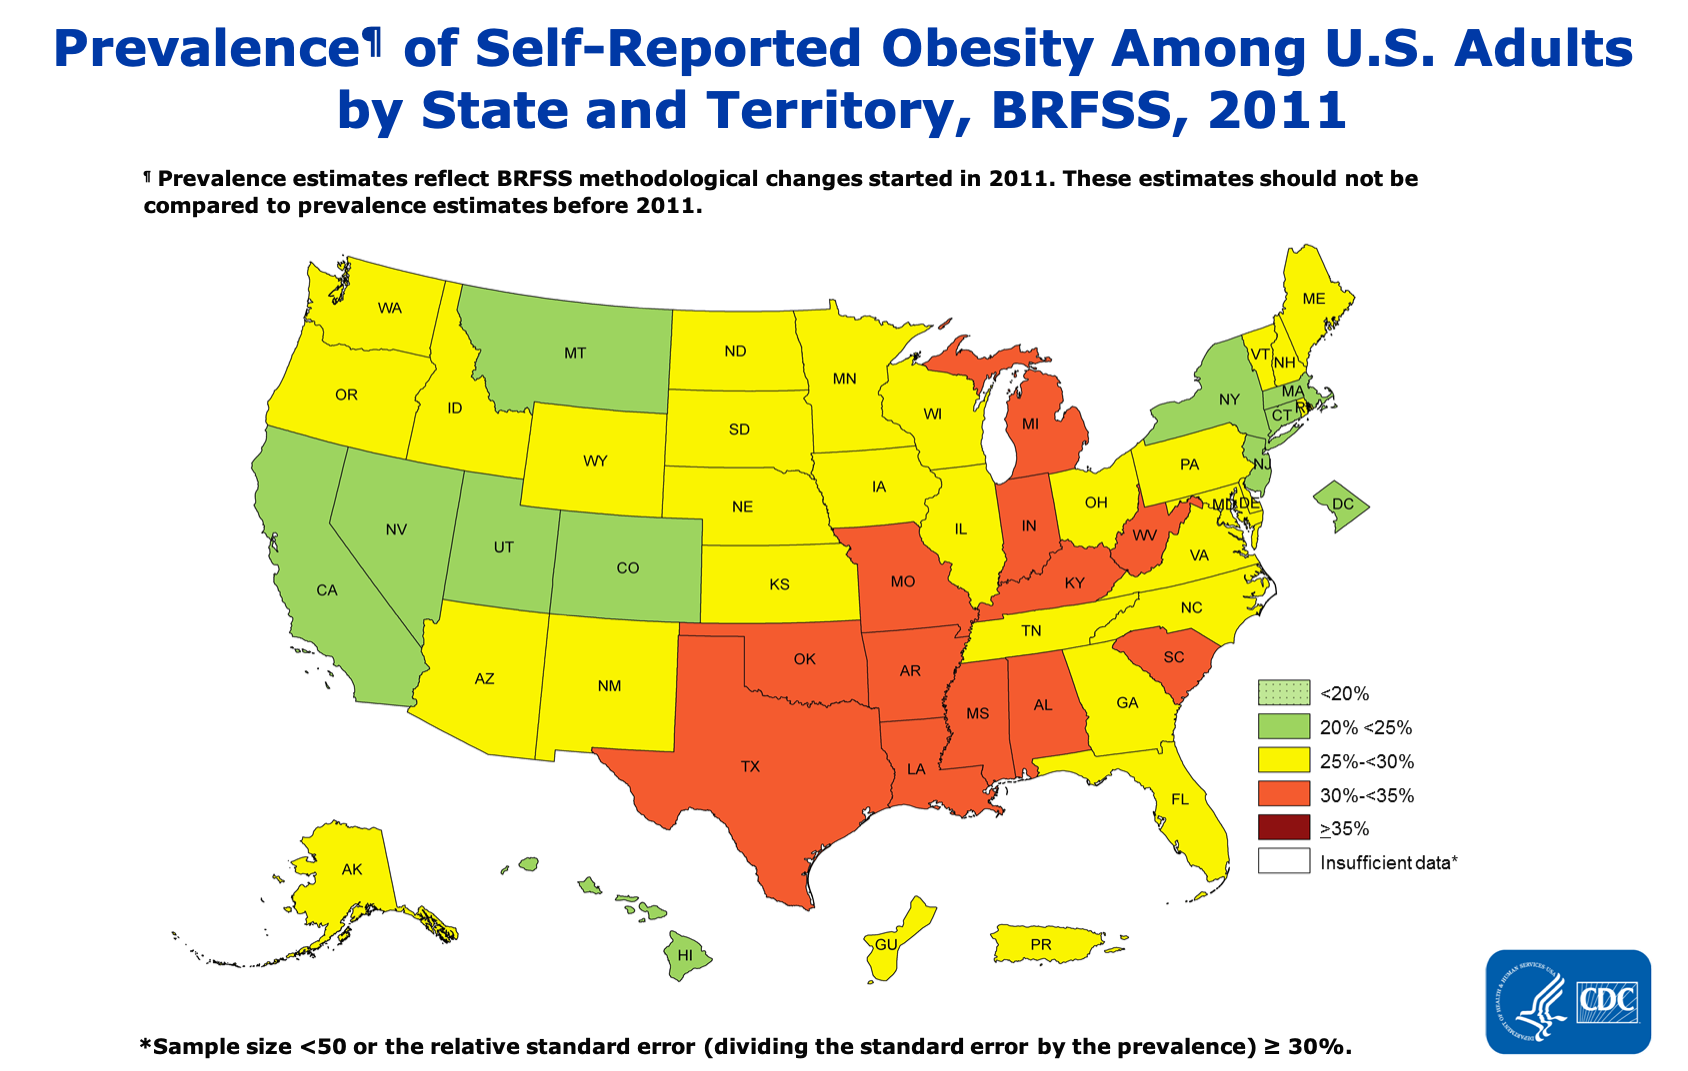
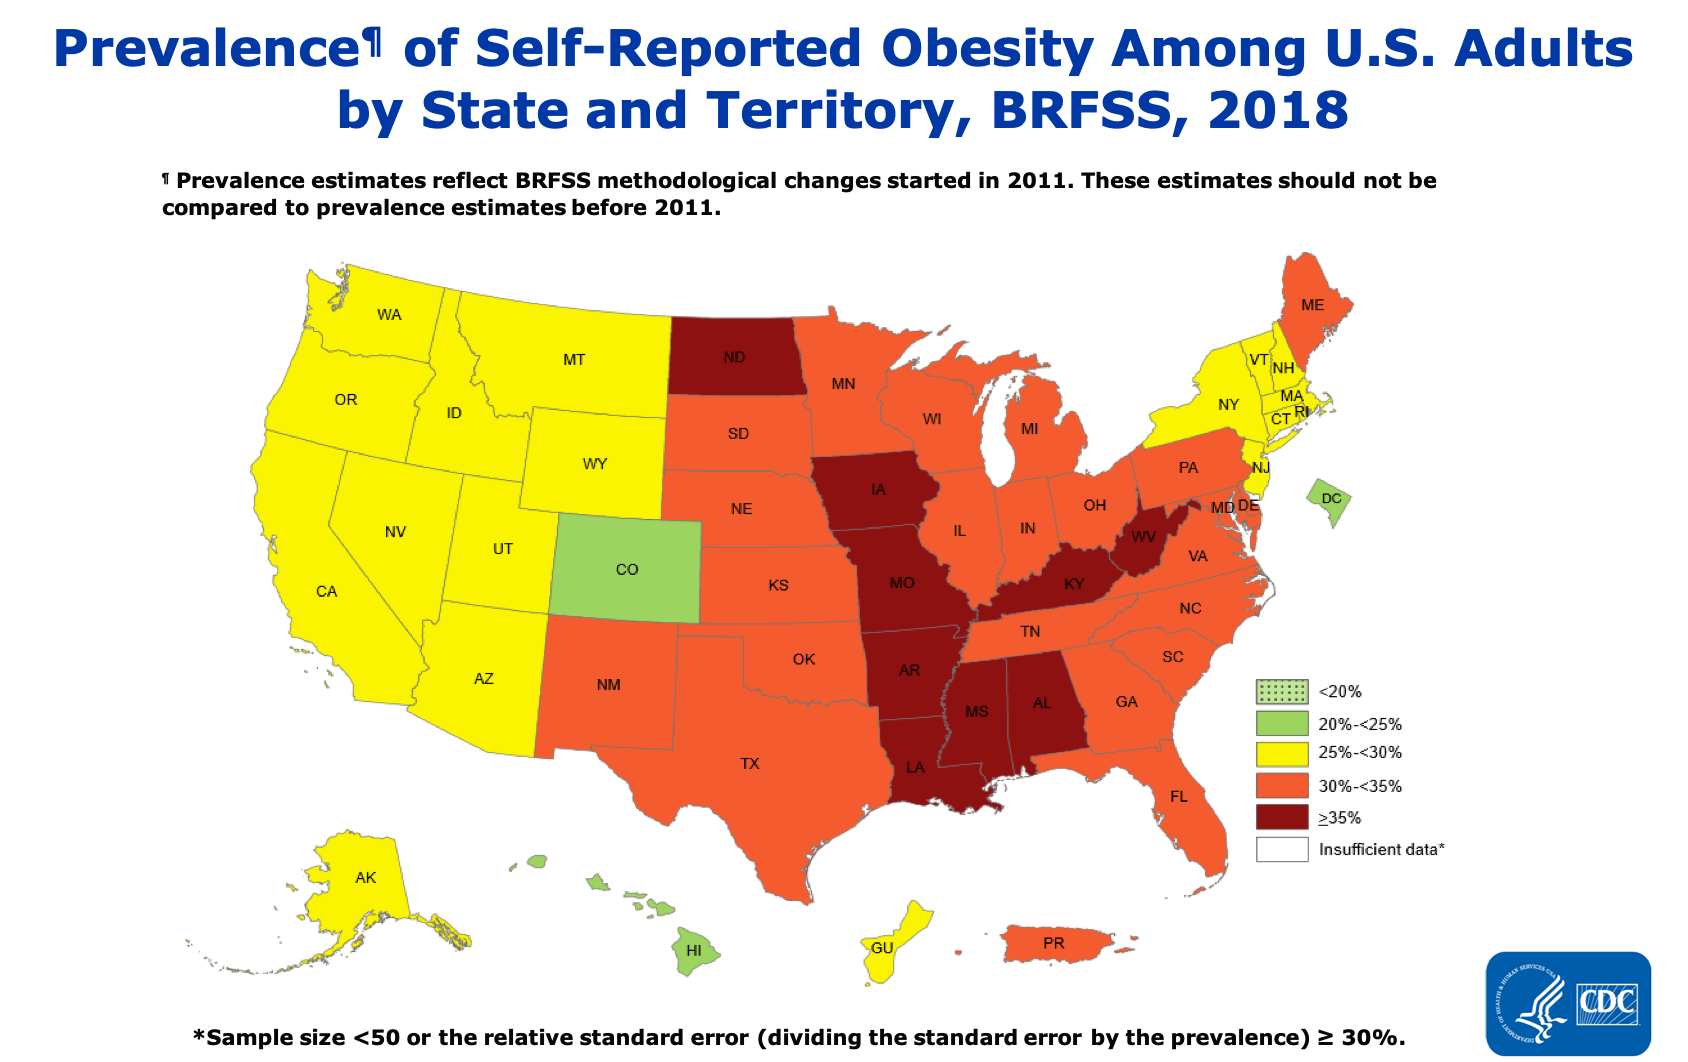
The methods used by the CDC to collect the data changed in 2011, so we can’t make direct comparisons between the periods before and after that change, but the trend has continued. Every year, more and more people in the U.S. are obese.
Figure 7.18. The prevalence of obesity among U.S. adults has continued to rise between 2011 and 2018.
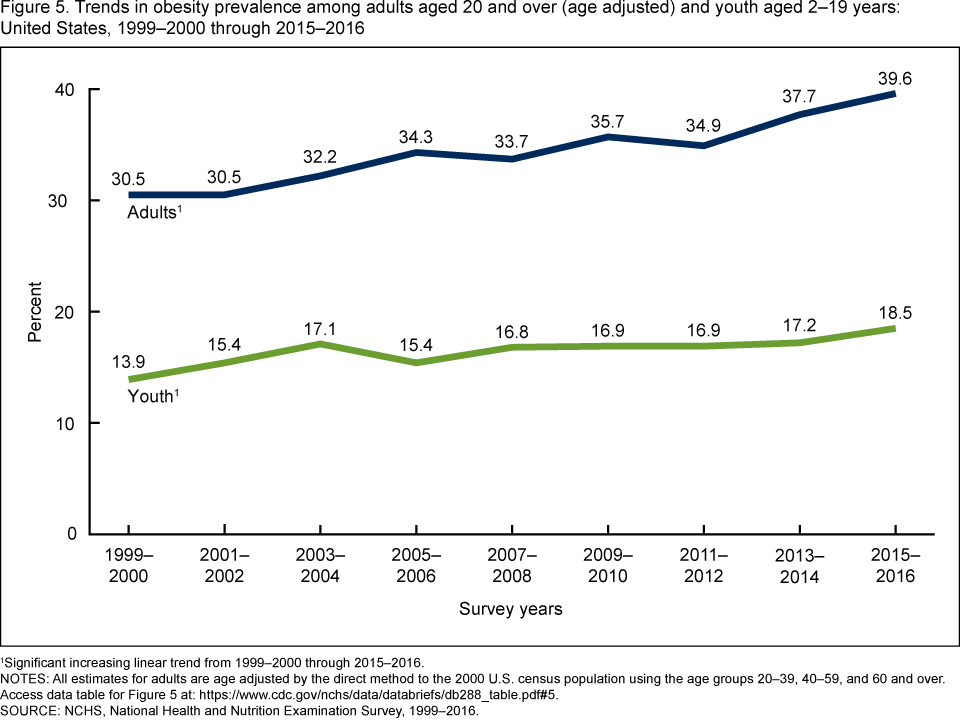
These trends are unmistakable, and they’re not just occurring in adults. Childhood obesity has seen similar increases over the last few decades—perhaps an even greater concern as the metabolic and health effects of carrying too much weight can be compounded over a person’s entire lifetime.
Figure 7.19. Between 1999 and 2016, the prevalence of obesity in both children and adults has risen steadily.
While obesity is a problem across the United States, it affects some groups of people more than others. Based on 2015-2016 data, obesity rates are higher among Hispanic (47 percent) and Black adults (47 percent) compared with white adults (38 percent). Non-Hispanic Asians have the lowest obesity rate (13 percent). And overall, people who are college-educated and have a higher income are less likely to be obese.2 These health disparities point to the importance of looking at social context when examining causes and solutions. Not everyone has the same opportunity for good health, or an equal ability to make changes to their circumstances, because of factors like poverty and longstanding inequities in how resources are invested in communities. These factors are called “social determinants of health.”3
The obesity epidemic is also not unique to the United States. Obesity is rising around the globe, and in 2015, it was estimated to affect 2 billion people worldwide, making it one of the largest factors affecting poor health in most countries .4 Globally, among children aged 5 to 19 years old, the rate of overweight increased from 10.3 percent in 2000 to 18.4 percent in 2018. Previously, overweight and obesity mainly affected high-income countries, but some of the most dramatic increases in childhood overweight over the last decade have been in low income countries, such as those in Africa and South Asia, corresponding to a greater availability of inexpensive, processed foods.5
Despite the gravity of the problem, no country has yet been able to implement policies that have reversed the trend and brought about a decrease in obesity. This represents “one of the biggest population health failures of our time,” wrote an international group of researchers in the journal The Lancet in 2019.6 The World Health Organization has set a target of stopping the rise of obesity by 2025. Doing so requires understanding what is causing the obesity epidemic; it is only when these causes are addressed that change can start to occur.
Causes of the Obesity Epidemic
If obesity was an infectious disease sweeping the globe, affecting billions of people’s health, longevity, and productivity, we surely would have addressed it by now. Researchers and pharmaceutical companies would have worked furiously to develop vaccines and medicines to prevent and cure this disease. But the causes of obesity are much more complex than a single bacteria or virus, and solving this problem means recognizing and addressing a multitude of factors that lead to weight gain in a population.
Behavior
At its core, rising obesity is caused by a chronic shift towards positive energy balance—consuming more energy or calories than one expends each day, leading to an often gradual but persistent increase in body weight. People often assume that this is an individual problem, that those who weigh more simply need to change their behavior to eat less and exercise more, and if this doesn’t work, it must be because of a personal failing, such as a lack of self-control or motivation. While behavior patterns such as diet and exercise can certainly impact a person’s risk of developing obesity (as we’ll cover later in this chapter), the environments where we live also have a big impact on our behavior and can make it much harder to maintain energy balance.
Environment
Many of us live in what researchers and public health experts call “obesogenic environments.” That is, the ways in which our neighborhoods are built and our lives are structured influence our physical activity and food intake to encourage weight gain .7 Human physiology and metabolism evolved in a world where obtaining enough food for survival required significant energy investment in hunting or gathering—very different from today’s world where more people earn their living in sedentary occupations. From household chores, to workplace productivity, to daily transportation, getting things done requires fewer calories than it did in past generations.
Figure 7.20. Some elements of our environment that may make it easier to gain weight include sedentary jobs, easy access to inexpensive calories, and cities built more for car travel than for physical activity.
Our jobs have become more and more sedentary, with fewer opportunities for non-exercise thermogenesis (NEAT) throughout the day. There’s less time in the school day for recess and physical activity, and fears about neighborhood safety limit kids’ ability to get out and play after the school day is over. Our towns and cities are built more for cars than for walking or biking. We can’t turn back the clock on human progress, and finding a way to stay healthy in obesogenic environments is a significant challenge.
Our environments can also impact our food choices. We’re surrounded by vending machines, fast food restaurants, coffeeshops, and convenience stores that offer quick and inexpensive access to calories. These foods are also heavily advertised, and especially when people are stretched thin by working long hours or multiple jobs, they can be a welcome convenience. However, they tend to be calorie-dense (and less nutrient-dense) and more heavily processed, with amounts of sugar, fat, and salt optimized to make us want to eat more, compared with home-cooked food. In addition, portion sizes at restaurants, especially fast food chains, have increased over the decades, and people are eating at restaurants more and cooking at home less.
Poverty and Food Insecurity
Living in poverty usually means living in a more obesogenic environment. Consider the fact that some of the poorest neighborhoods in the United States—with some of the highest rates of obesity—are often not safe or pleasant places to walk, play, or exercise. They may have busy traffic and polluted air, and they may lack sidewalks, green spaces, and playgrounds. A person living in this type of neighborhood will find it much more challenging to get adequate physical activity compared with someone living in a neighborhood where it’s safe to walk to school or work, play at a park, ride a bike, or go for a run.
In addition, poor neighborhoods often lack a grocery store where people can purchase fresh fruits and vegetables and basic ingredients necessary for cooking at home. Such areas are called “food deserts”—where healthy foods simply aren’t available or easily accessible.
Another concept useful in discussions of obesity risk is “food insecurity.” Food security means “access by all people at all times to enough food for an active, healthy life.”8 Food insecurity means an inability to consistently obtain adequate food. It may seem counter-intuitive, but in the United States, food insecurity is linked to obesity. That is, people who have difficulty obtaining enough food are more likely to become obese and to suffer from diabetes and hypertension. This is likely related to the fact that inexpensive foods tend to be high in calories but low in nutrients, and when these foods form the foundation of a person’s diet, they can cause both obesity and nutrient deficiencies. It’s estimated that 12 percent of U.S. households are food insecure, and food insecurity is higher among Black (22 percent) and Latino (18 percent) households.3
Genetics
What about genetics? While it’s true that our genes can influence our susceptibility to becoming obese, researchers say they can’t be a cause of the obesity epidemic. Genes take many generations to evolve, and the obesity epidemic has occurred over just the last 40 to 50 years—only a few generations. When our grandparents were children, they were much less likely to become obese than our own children. That’s not because their genes were different, but rather because they grew up in a different environment. However, it is true that a person’s genes can influence their susceptibility to becoming obese in this obesogenic environment, and obesity is more prevalent in some families. A person’s genetic make-up can make it more difficult to maintain energy balance in an obesogenic environment, because certain genes may make you feel more hungry or slow your energy expenditure.2
Solutions to the Obesity Epidemic
Given the multiple causes of obesity, solving this problem will also require many solutions at different levels. Because obesity affects people over the lifespan and is difficult to reverse, the focus of many of these efforts is prevention, starting as early as the first years of life. We’ll discuss individual weight management strategies later in this chapter. Here, we’ll review some strategies happening in schools, communities, and at the state and federal levels.
Support Healthy Dietary Patterns
Interventions that support healthy dietary patterns, especially among people more vulnerable because of food insecurity or poverty, may reduce obesity. In some cases, studies have shown that they have an impact, and in other cases, it’s too soon to know. Here are some examples:
- Implement and support better nutrition standards for childcare, schools, hospitals, and worksites.9
- Limit marketing of processed foods, especially ads targeted towards children.
- Provide incentives for supermarkets or farmers markets to establish businesses in underserved areas.9
Figure 7.21. Farmers markets can expand healthy food options for neighborhoods and build connections between consumers and local farmers.
- Place nutrition and calorie content on restaurant and fast food menus to raise awareness of food choices.9 Beginning in 2018, as part of the Affordable Care Act, chain restaurants with more than 20 locations were required to add calorie information to their menus, and some had already done so voluntarily. There isn’t yet enough research to say whether having this information improves customers’ choices; some studies show an effect and others don’t.10 Many factors influence people’s decisions, and the type of restaurant, customer needs, and menu presentation all likely matter. For example, some studies show that health-conscious consumers choose lower calorie menu items when presented with nutrition information, but people with food insecurity may understandably choose higher calorie items to get more “bang for their buck”.11 Research has also shown that adding interpretative images—like a stoplight image labeling menu choices as green or red as shorthand for high or low nutrient density—can help. And a 2018 study found that when calorie counts are on the left side of English-language menus, people order lower-calorie menu items. Putting calorie counts on the right side of the menu (as is more common) doesn’t have this effect, likely because the English language is read from left to right.12 Some studies have also found that restaurants that implement menu labeling offer lower-calorie and more nutrient-dense options, indicating that menu labeling may push restaurants to look more closely at the food they serve.10,13
Figure 7.22. As of 2018, restaurant chains and some other food vendors are required to list calorie counts on their menus. Would these make you pause before ordering?
- Increase access to food assistance programs and align them with nutrition recommendations. For example, in 2009, the U.S. Department of Agriculture revised the food packages for the Women, Infants, and Children (WIC) program to better align with the Dietary Guidelines for Americans. The new packages emphasized more fruits, vegetables, whole grains, and low-fat dairy and decreased the availability of juice. After this change, there was a decrease in the obesity rate of children in the WIC program. Similar progress may be made by increasing access to the Supplemental Nutrition Assistance Program (SNAP) in order to reduce food insecurity. Many farmers’ markets now accept SNAP benefits for the purchase of fresh fruit and vegetables.3
- Tax sugary drinks, such as soda and sports drinks, which contribute significant empty calories to the U.S. diet and are associated with childhood obesity. Local taxes on soda and other sugary drinks are often controversial, and soda companies lobby to prevent them from passing. However, early research in U.S. cities with soda taxes show that they do work to decrease soda consumption.3 In the U.S., soda has only been taxed at the local level, and the tax has been paid by consumers. The United Kingdom has taken a different approach: They started taxing soft drink manufacturers for the sugar content of the products they sell. Between 2015 and 2018, the average sugar content of soda sold in the U.K. dropped by 29 percent.14
Support Greater Physical Activity
Increasing physical activity increases the energy expended during the day. This can help maintain energy balance, thus preventing weight gain. It may also help to shift a person into negative energy balance and facilitate weight loss if needed. But simply adding an exercise session—a run or a trip to the gym, say—often doesn’t shift energy balance (though it’s certainly good for health). Why? Exercise can increase hunger, and there’s only so many calories a person can burn in 30 or 60 minutes. That’s why it’s also important to look for opportunities for non-exercise activity thermogenesis (NEAT); that is, find ways to increase movement throughout the day.
- Prioritize physical education and recess time in schools. In addition to helping kids stay healthy, movement also helps them learn.
- Make neighborhoods safer and more accessible for walking, cycling, and playing.
- When safe, encourage kids to walk or bike to school.
- Build family and community activities around physical activity, such as trips to the park, walks together, and community walking and exercise groups.
- Facilitate more movement in the workday by encouraging walking meetings, movement breaks, and treadmill desks.
- Find ways to move that are enjoyable to you and fit your life. Yard work, walking your dog, playing tag with your kids, and going out dancing all count!

Figure 7.23. There are lots of ways to increase physical activity, including walking to work, playing with friends, and going for a bike ride.
VIDEO: "James Levine: ‘I Came Alive as a Person’" by NOVA’s Secret Life of Scientists and Engineers, YouTube (April 24, 2014), 3:04 minutes. This short video explains some of the research on NEAT and efforts to increase it in our lives.
VIDEO: "The Weight of the Nation: Poverty and Obesity" by HBO Docs, YouTube (May 14, 2012), 24:05 minutes.
VIDEO: "The Weight of the Nation: Healthy Foods and Obesity Prevention" by HBO Docs, YouTube (May 14, 2012), 31:11 minutes. These segments from the HBO documentary series, “The Weight of the Nation,” explore some of the causes and potential solutions for obesity.
Review Questions
References:
- 1CDC. (2019, September 12). New Adult Obesity Maps. Retrieved October 30, 2019, from Centers for Disease Control and Prevention website: https://www.cdc.gov/obesity/data/prevalence-maps.html
- 2CDC. (2019, January 31). Adult Obesity Facts | Overweight & Obesity | CDC. Retrieved October 30, 2019, from https://www.cdc.gov/obesity/data/adult.html
- 3Trust for America’s Health. (2019). The State of Obesity: Better Policies for a Healthier America. Retrieved from https://www.tfah.org/report-details/stateofobesity2019/
- 4Swinburn, B. A., Kraak, V. I., Allender, S., Atkins, V. J., Baker, P. I., Bogard, J. R., … Dietz, W. H. (2019). The Global Syndemic of Obesity, Undernutrition, and Climate Change: The Lancet Commission report.
The Lancet, 393(10173), 791–846. https://doi.org/10.1016/S0140-6736(18)32822-8
- 5UNICEF. (2019). The State of the World’s Children 2019. Children, Food and Nutrition: Growing well in a changing world. New York.
- 6Jaacks, L. M., Vandevijvere, S., Pan, A., McGowan, C. J., Wallace, C., Imamura, F., … Ezzati, M. (2019). The obesity transition: Stages of the global epidemic. The Lancet Diabetes & Endocrinology, 7(3), 231–240. https://doi.org/10.1016/S2213-8587(19)30026-9
- 7Townshend, T., & Lake, A. (2017). Obesogenic environments: Current evidence of the built and food environments. Perspectives in Public Health, 137(1), 38–44. https://doi.org/10.1177/1757913916679860
- 8Pan, L., Sherry, B., Njai, R., & Blanck, H. M. (2012). Food Insecurity Is Associated with Obesity among US Adults in 12 States. Journal of the Academy of Nutrition and Dietetics, 112(9), 1403–1409. https://doi.org/10.1016/j.jand.2012.06.011
- 9CDC. (2019, June 18). Community Efforts | Overweight & Obesity | CDC. Retrieved October 30, 2019, from https://www.cdc.gov/obesity/strategies/community.html
- 10Bleich, S. N., Economos, C. D., Spiker, M. L., Vercammen, K. A., VanEpps, E. M., Block, J. P., … Roberto, C. A. (2017). A Systematic Review of Calorie Labeling and Modified Calorie Labeling Interventions: Impact on Consumer and Restaurant Behavior.
Obesity (Silver Spring, Md.), 25(12), 2018–2044. https://doi.org/10.1002/oby.21940
- 11Berry, C., Burton, S., Howlett, E., & Newman, C. L. (2019). Understanding the Calorie Labeling Paradox in Chain Restaurants: Why Menu Calorie Labeling Alone May Not Affect Average Calories Ordered.
Journal of Public Policy & Marketing, 38(2), 192–213. https://doi.org/10.1177/0743915619827013
- 12Dallas, S. K., Liu, P. J., & Ubel, P. A. (2019). Don’t Count Calorie Labeling Out: Calorie Counts on the Left Side of Menu Items Lead to Lower Calorie Food Choices. Journal of Consumer Psychology, 29(1), 60–69.
https://doi.org/10.1002/jcpy.1053
- 13Theis, D. R. Z., & Adams, J. (2019). Differences in energy and nutritional content of menu items served by popular UK chain restaurants with versus without voluntary menu labelling: A cross-sectional study.
PLOS ONE, 14(10), e0222773. https://doi.org/10.1371/journal.pone.0222773
- 14Public Health England. (2019). Sugar reduction: Report on progress between 2015 and 2018. Retrieved from https://assets.publishing.service.gov.uk/government/uploads/system/uploads/attachment_data/file/832182/Sugar_reduction__Yr2_progress_report.pdf
Image Credits
- Figure 7.17. "Obesity Trends Among U.S. Adults, BRFSS, 1990-2010" by Division of Nutrition, Physical Activity, and Obesity, National Center for Chronic Disease Prevention and Health Promotion, Centers for Disease Control and Prevention is in the Public Domain
- Figure 7.18. "Prevalence of self-reported obesity among U.S. adults in 2011 and 2018" by Division of Nutrition, Physical Activity, and Obesity, National Center for Chronic Disease Prevention and Health Promotion, Centers for Disease Control and Prevention is in the Public Domain
- Figure 7.19. "Trends in obesity prevalence" by National Center for Health Statistics is in the Public Domain
- Figure 7.20. Elements of obesogenic environment: "wocintech" by WOCinTech Cha is licensed under CC BY 2.0; "Perfect timing" by Tamara Menzi, Unsplash is in the Public Domain, CC0; "Vending machines" by Purchase College Library is licensed under CC BY-NC 2.0
- Figure 7.21. Farmers markets. "group of people standing near vegetables" by Megan Markham is in the Public Domain, CC0; "Veggies at Corvallis Farmers Market"by Friends of Family Farmersis licensed under CC BY-ND 2.0
- Figure 7.22. Menu labeling. "Ballpark Calorie Counting" by Kevin Harber is licensed under CC BY-NC-ND 2.0
- Figure 7.23. Increasing physical activity. "Early bird"by Jorge Vasconez is in the Public Domain, CC0; "boy running to the future" by Rafaela Biazi is in the Public Domain, CC0; "people riding bicycles inside bicycle lane beside skyscraper" by Steinar Engeland is in the Public Domain, CC0
An enlarged thyroid gland caused by a deficiency in iodine.
A gland located in the neck that produces both thyroid hormone and calcitonin.
The universal chemical solvent in which most of the processes of life occur.
A small amount of sodium iodide or potassium iodide that is added to table salt in order to supplement the iodine content of the diet.
Determining Your Healthy Size
There are many metrics used to assess body composition (and we’ll discuss some of these later), but none give a complete picture of an individual’s health. That requires a truly individual assessment, not just of numbers on the scale, but of a person’s overall health and well-being in the context of family history and lifestyle.
Here’s how the authors of the text, “Sport Nutrition for Health and Performance” describe a healthy body weight:
- A weight that is appropriate for your age and physical development
- A weight you can achieve and sustain without severely curtailing your food intake and constantly dieting
- A weight that is compatible with normal blood pressure, lipid levels, and glucose tolerance (in other words, you are metabolically fit)
- A weight that is based on your genetic background and family history of body shape and weight (after all the apple doesn’t fall too far from the tree)
- A weight that promotes good eating habits and allows you to participate in regular physical activity
- A weight that is acceptable to you
Overall, a healthy size should not be dictated by a formula, the latest fad, or societal expectations. People come in all shapes and sizes, and you have to determine what a healthy size is for you. Yet it’s also worth understanding some of the measures used to estimate body composition, how they can be linked to health, and their limitations.
Body Mass Index
Body Mass Index (BMI) is an inexpensive screening tool used in clinical and research settings to assess body weight relative to height. Because it takes height into account, it is more predictive of how much body fat a person has than weight alone. However, BMI is not a direct measure of body fat, so it shouldn’t be used on its own to diagnose obesity or the health of an individual.1
BMI calculations and categories
BMI is calculated using the following equations:
BMI = [weight (kg)/height (m2)]
OR
BMI = [weight (lb)/height (in2)] x 703
The Centers for Disease Control and Prevention has a BMI calculator on its website: https://www.cdc.gov/healthyweight/assessing/bmi/adult_bmi/english_bmi_calculator/bmi_calculator.html
BMI interpretation in adults:
- Underweight - BMI < 18.5
- Normal weight - BMI from 18.5-24.9
- Overweight - BMI from 25-29.9
- Obese - BMI from 30 or higher
Obesity is frequently subdivided into categories:
- Class 1 obesity: BMI of 30 to < 35
- Class 2 obesity: BMI of 35 to < 40
- Class 3 obesity: BMI of 40 or higher
(BMI values are interpreted differently for children, because body fatness changes with age and can be different between boys and girls.)
In general, BMI in the “normal” range is associated with better health compared to both underweight and overweight or obese values, because there are risks of carrying both too little and too much body fat. When researchers have looked at BMI and health in large groups of people, they generally find that the lowest risk of disease and of dying younger is in the range of BMI of 20 to 25. As BMI values increase into the overweight and obese ranges, the risk of developing type 2 diabetes, cardiovascular disease and stroke, and even cancer increase, as well as other complications of obesity, such as osteoarthritis.2,3,4 Carrying extra weight not only puts a mechanical strain on the body, but it also negatively impacts metabolic health and increases inflammation.5
Limitations of BMI
The advantage of BMI is that it’s simple and easy to calculate, but it also has several important limitations. Since it’s only based on weight and height, it doesn’t distinguish between muscle mass and adipose tissue. It’s not unusual for muscular athletes to be classified as overweight based on BMI, but this can be misleading, because they may have little to no excess body fat. On the flipside, BMI can underestimate body fatness in someone with very low muscle mass, such as a person who is elderly and frail. In addition, BMI can’t tell us where body fat is located in the body, and as we’ll learn, this is a major factor determining its impact on health.
BMI’s accuracy in predicting body fatness is also affected by biological sex and race—not surprising given the natural diversity in shape and size of human bodies. At the same BMI, women tend to carry more body fat than men. Also at the same BMI, a Black person tends to have less body fat, and an Asian person tends to have more body fat, compared to a white person. This means that a high BMI may overestimate health risk in a Black person and underestimate health risk in an Asian person. BMI is also not useful for estimating body fatness in a pregnant person, because pregnancy weight gain includes placental and fetal tissues.1
The correlation between the BMI and body fatness is fairly strong1,2,3,7, but even if two people have the same BMI, their level of body fatness may differ12.
In general,
- At the same BMI, women tend to have more body fat than men.
- At the same BMI, Blacks have less body fat than do Whites13,14, and Asians have more body fat than do Whites15.
- At the same BMI, older people, on average, tend to have more body fat than younger adults.
- At the same BMI, athletes have less body fat than do non-athletes.
All of this means that BMI is not particularly useful for comparing one individual to another individual or even one population to another, because this one number simply doesn’t account for all of the underlying diversity in factors like body type, muscle mass, biological sex, and race. And for an individual, one BMI measurement at a single point in time may not be all that meaningful—other measurements and clinical assessments are needed to diagnose obesity and more accurately assess disease risk, as we’ll discuss in a moment.
BMI is perhaps most useful for tracking changes in body composition over time, whether of a population or an individual. For example, the data on average BMI in the U.S. show a clear increase over the last several decades, and the most likely explanation for that is not that people in the U.S. are all gaining several pounds of muscle each year, but that we’re putting on more fat. On the other hand, someone may have a BMI classified as overweight, but if they’ve been at that BMI their entire adult life and are active and metabolically healthy, that may just be the natural size and shape of their body.
Measuring Body Composition
A person’s body mass is made up of water, lean body mass (including organs, bone, and muscle), fat, and other components like minerals. The weight on the scale does not distinguish between these different components, but body composition measurements can.
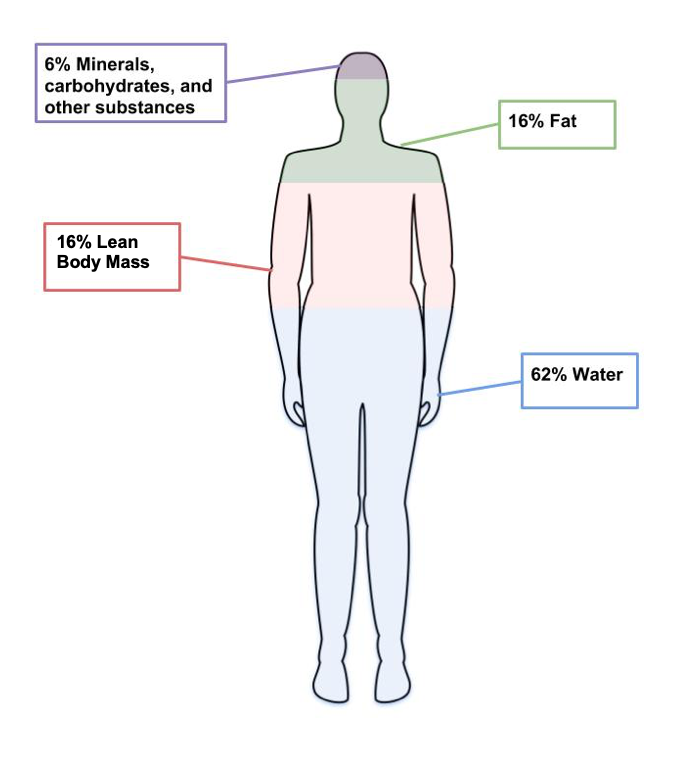
Figure 7.8. The four main components of body weight are water, fat, lean body mass and other components like minerals.
Body composition measurements are used by individuals and researchers to determine how much of a person’s weight is made up of body fat and lean body mass. An individual might use body composition measurements to track their progress in building muscle with a new strength training program. Since increased body fat is often a risk factor for diseases like cardiovascular diseases and diabetes, researchers are often interested in this type of data. There are several different methods used to measure body composition, each with advantages and limitations.6
- Skinfold test. This is a simple, non-invasive, and low-cost way to assess fat mass. Calipers are used to measure the thickness of skin on three to seven different parts of the body, and these numbers are then entered into a conversion equation. Keep in mind that the accuracy of the skinfold test depends on the skill of the person taking the measurements, the accuracy of the calipers, and the appropriateness of the conversion equations. Best practice is for the same person to take repeated measurements if using them to monitor changes over time. Repeated measurements by different technicians, using different calipers, and different conversion equations will yield very different results.
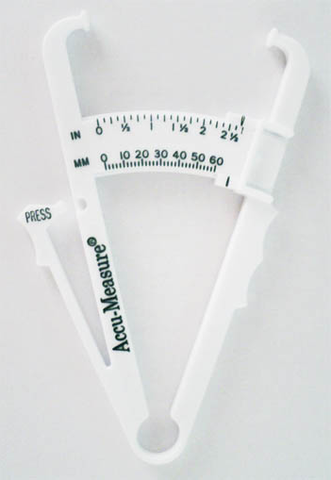
Figure 7.9. Calipers used to assess body fat during skinfold testing.
- Bioelectric Impedance Analysis (BIA). This is a simple, non-invasive, quick tool that does not require extensive training. BIA estimates body composition by sending a small amount of electricity through the body. Since water is a good conductor of electricity, and lean body mass contains more water than fat, the rate at which the current travels can be used to estimate percent body fat. Body fluid levels must be normal with BIA, which is a limitation, since hydration can be impacted by exercise, alcohol, and menstrual cycles.

Figure 7.10. BIA hand device.
- Air displacement plethysmography (ADP) - This is a non-invasive, quick tool that does not take extensive training. It’s more accurate but also more expensive than BIA. While a person sits inside an enclosed chamber (usually called a Bod Pod), changes in air pressure are used to determine the amount of air that is displaced in the test chamber, which can determine body volume. These measurements are then translated into percent body fat. Hydration status can affect the accuracy of this test. This test also needs to be conducted in a facility with a Bod Pod, so it is not as accessible as the skinfold test or the BIA.
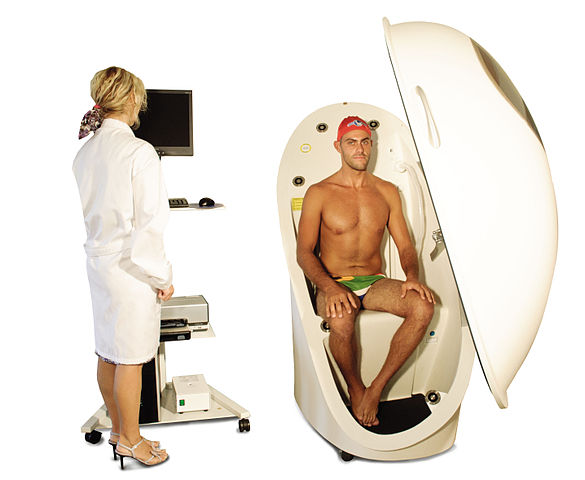
Figure 7.11. Body composition measurement with whole-body air displacement plethysmography (ADP) technology or BodPod
- Dual-energy X-ray absorptiometry (DXA). This method directs two low-dose X-ray beams through the body and determines the amount of energy absorbed from the beams. The amount of energy absorbed is dependent on the body’s content of bone, lean tissue mass, and fat mass. Using standard mathematical formulas, fat content and bone density can be accurately estimated. Although this is one of the most accurate methods of measuring fat mass, it is expensive and mostly used in research. It also requires low doses of radiation to the subject being tested, and is not appropriate for pregnant women.
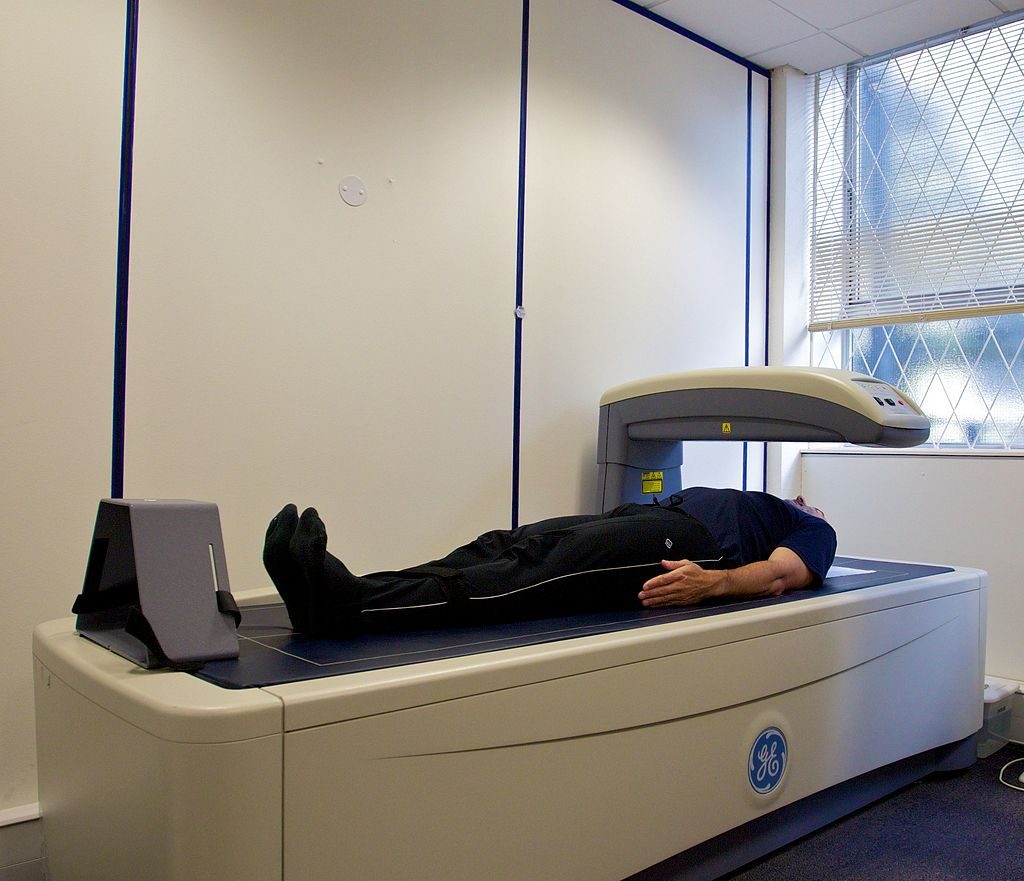
Figure 7.12. Dual-Energy X-ray Absorptiometry (DXA)
Keep in mind that body composition can be hard to measure accurately when using inexpensive and accessible techniques like skinfold testing and BIA. Your best bet is to pick one method and use that method over time to compare numbers and see how they change. Just don't get too hung up on the actual number, as the accuracy will be questionable depending on the method chosen.
Measuring Fat Distribution
Total body fat is one predictor of health; another is how the fat is distributed in the body. The location of fat is important, because people who store fat more centrally (apple-shaped) have a higher risk for chronic disease—like cardiovascular disease and type 2 diabetes—compared to people who store fat in the hips, thighs, and buttocks (pear-shaped). This is because visceral fat that surrounds vital organs (common in central obesity or apple-shaped fat patterning) is more metabolically active, releasing more hormones and inflammatory factors thought to contribute to disease risk compared to subcutaneous fat. Subcutaneous fat stored just below the skin (common in pear-shaped fat patterning) does not seem to significantly increase the risk for chronic disease.
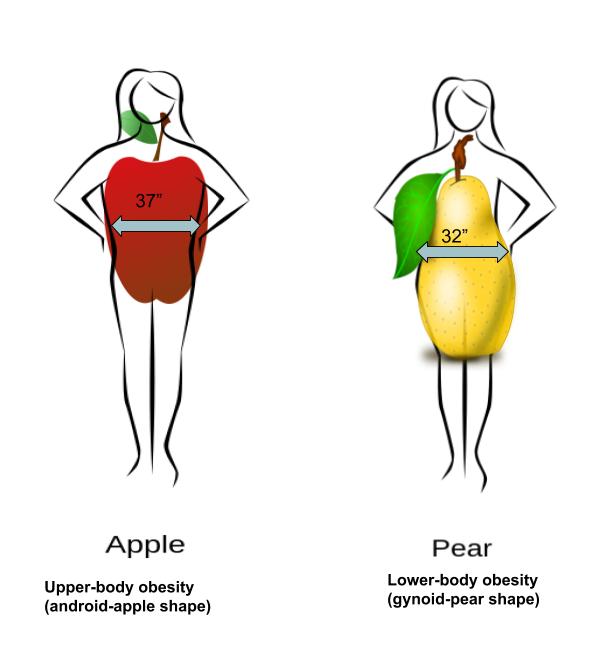
Figure 7.13. Fat can be located in the abdominal region (apple shape) or hips, thighs, and buttocks (pear shape).
Body fat distribution can be measured by waist circumference and waist-to-hip ratio, both of which only require a measuring tape.
- Waist circumference is measured just above the hip bone, level with your belly button. Men with a waist circumference greater than 40 inches and women with a waist circumference greater than 35 inches are predicted to face greater health risks.
- Waist-to-hip ratio is calculated by measuring waist circumference and hip circumference (at its widest part) and dividing the two values. Abdominal obesity is defined by the World Health Organization as a waist-to-hip ratio above 0.90 for males and above 0.85 for females.
Indicators of Metabolic Health
Metabolic health refers to the body’s ability to maintain normal homeostasis and effectively regulate measures like blood pressure, blood lipids, and blood glucose. It is assumed that when an individual is classified as overweight and obese, based on measurements of BMI and body fat composition and distribution, metabolic health is negatively impacted. However, some individuals that meet the criteria for obesity do not experience an increased risk of metabolic health.7 These individuals are known as “metabolically healthy obese” (MHO). Metabolically healthy can be described as an absence of insulin resistance, type 2 diabetes, dyslipidemia, and hypertension.
In contrast, there are also individuals who are classified as a healthy weight (BMI < 25) but show an increased metabolic risk. These individuals are known as metabolically obese normal weight (MONW).
These variations challenge the assumptions we hold about body fatness. It can not always be assumed that thinness equals healthy, and fatness equals unhealthy.
ntrast, there are also individuals who are classified as a healthy weight (BMI < 25) but show an increased metabolic risk. These individuals are known as metabolically obese normal weight (MONW).
Review Questions
hese variations challenge the assumptions we hold about body fatness. It can not always be assumenness equals healthy, and fatness equals unhealthy.
References:
- Manore, M.M., Meyer, N.L., & Thompson, J.L. (2009). Sport Nutrition for Health and Performance, 2nd ed. Champagn, IL: Human Kinetics.
- NBHLI. (2013). Managing Overweight and Obesity in Adults: Systematic Evidence Review from the Obesity Expert Panel. Retrieved October 27, 2019 from https://www.nhlbi.nih.gov/health-topics/managing-overweight-obesity-in-adults
- 1Centers for Disease Control and Prevention. (2019, March 1). About Adult BMI | Healthy Weight | CDC. Retrieved October 27, 2019, from https://www.cdc.gov/healthyweight/assessing/bmi/adult_bmi/index.html
- 2Aune, D., Sen, A., Prasad, M., Norat, T., Janszky, I., Tonstad, S., … Vatten, L. J. (2016). BMI and all cause mortality: Systematic review and non-linear dose-response meta-analysis of 230 cohort studies with 3.74 million deaths among 30.3 million participants. The BMJ, 353. https://doi.org/10.1136/bmj.i2156
- 3Bhaskaran, K., dos-Santos-Silva, I., Leon, D. A., Douglas, I. J., & Smeeth, L. (2018). Association of BMI with overall and cause-specific mortality: A population-based cohort study of 3·6 million adults in the UK. The Lancet. Diabetes & Endocrinology, 6(12), 944–953. https://doi.org/10.1016/S2213-8587(18)30288-2
- 4The Global BMI Mortality Collaboration. (2016). Body-mass index and all-cause mortality: Individual-participant-data meta-analysis of 239 prospective studies in four continents. Lancet, 388(10046), 776–786.
- 5Greenberg, A.S., & Obin, M.S. (2006). Obesity and the role of adipose tissue in inflammation and metabolism. American Journal of Clinical Nutrition, 83(2): 461S-465S. DOI: 10.1093/ajcn/83.2.461S
- 6Lemos, T., & Gallagher, D.( 2017). Current body composition measurement techniques. Current Opinion in Endocrinology & Diabetes and Obesity, 24(5), 310–314. doi: 10.1097/MED.0000000000000360
- 7Matthew, H., Farr, O.M., & Mantzoros, S.C. (2016). Metabolic Health and Weight: Understanding metabolically unhealthy normal weight or metabolically healthy obese patients. Metabolism, 65(1), 73-80. doi: 10.1016/j.metabol.2015.10.019
Images:
- “Walking exercise” by bluesbby is licensed under CC BY 2.0
- Figure 7.8. “Components of weight” by Allison Calabrese is licensed under CC BY 4.0
- Figure 7.9. “Body fat caliper” by Jks111 is licensed under CC BY-SA 3.0
- Figure 7.10. “BIA hand device” by United States Marine Corps is in the Public Domain
- Figure 7.11. “Body composition measurement with whole-body air displacement plethysmography (ADP) technology” by cosmed is licensed under CC BY-SA 3.0
- Figure 7.12. “A Dual-energy X-ray absorptiometry (DEXA) scan” by Nick Smith is licensed under CC BY-SA 3.0
- Figure 7.13. “Fat Distribution” by Allison Calabrese is licensed under CC BY 4.0

