2 Module II: Design
Design: Ideation and Invention
Elissa Ledoux and Nicholas Matta
ABET Student Outcomes
ENGR Student Outcome 2: an ability to apply engineering design to produce solutions that meet specified needs with consideration of public health, safety, and welfare, as well as global, cultural, social, environmental, and economic factors
ET Student Outcome 2: an ability to design systems, components, or processes meeting specified needs for broadly-defined engineering problems appropriate to the discipline
Engineering design is a process of devising a system, component, or process to meet desired needs and specifications within constraints. (ABET, 2024) This module covers the engineering design process, from brainstorming to project planning and economics, including the business aspect to contextualize the project in the real world.
II.1) Design Process
The engineering design process is an iterative cycle of design-build-test-repeat. It starts with identifying the problem, then brainstorming solutions and choosing the best one to implement. From that concept, develop a more detailed solution with mathematical calculations and 3D CAD, then build the device, test it, and evaluate the results. Make adjustments as necessary to improve quality and reliability, repeating the design-build-test cycle until the project is ready to deliver. This video provides an overview of the engineering design process using the real life example of robotic end effector design.
II.2) Brainstorming
Information
Brainstorming Slide Deck
Brainstorming Slide Deck – Instructors
Brainstorming – PowerPoint
Activity
II.3) System Flow Diagrams
Information
System flow diagrams (SFDs), sometimes called process flow diagrams (PFDs) show the logical flow of a system process. This includes:
- Movement of product through system
- Conditional decisions
- Communication/messages
- Human-machine interaction
The process for constructing a system flow diagram is:
- List functions of subsystems/components
- Connect in order with logic
- Indicate communication points
- Indicate human interaction points
Often, actions are shown in boxes, states are shown in bubbles, and conditional decisions are shown in diamonds. However, that is not a hard and fast standard, and many companies develop their own technique. There is no standard for the symbol that identifies points of data/communication, or human interaction, as long as the style used is consistent and indicated in the map key.
Examples of a simple system flow diagram, and two more complicated ones, are shown below:
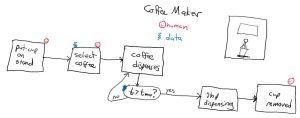
Example 1: Coffee Maker
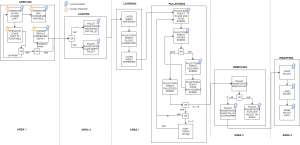
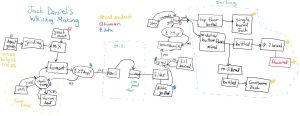
Activity
Now make a system flow diagram for your project following the procedure above:
- List functions of subsystems/components
- Connect in order with logic
- Indicate communication points
- Indicate human interaction points
II.4) Budget and Bill of Materials
Information
Budgets and bills of materials (BOM) are two ways of quantifying the cost and materials for a project, and most projects use both. Budgets are more general, while bills of materials are more specific.
Budget: a budget is a breakdown of the total cost of a project, including both parts (materials) and labor (time). At the beginning of a project, it includes categories with cost estimates for each. There could be one category for structural materials, one for sensors and electronics, one for labor, etc. As the project progresses, line items are entered in the budget for money actually spent. At the end of the project, estimated cost and actual cost are compared by category to guide future project estimates. An example project budget is shown below.
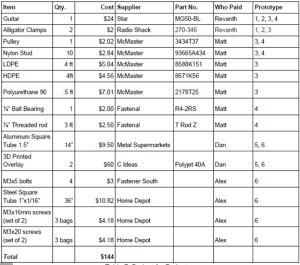
Bill of Materials (BOM): a bill of materials is the “shopping list” of parts required to construct a prototype. It is a table listing the part number, name, purpose, price, quantity, and supplier. Some BOMs include other information such as urls or PO numbers for item purchase. A BOM only includes the materials required for the current prototype design, and not materials that were previously purchased and then abandoned, leftovers, etc. Donated items that were used on the project, as well as custom 3D-printed or machined parts, must be included for a complete BOM.
BOM Example 1 Click to see PDF

Activity
For the first activity, make a forecasted budget for your project. Consider different categories such as structural materials, electronics, actuators, sensors, etc. and estimate how much you will spend on these. You may need to do a little research on how much certain items cost. Download the worksheet below to help organize your budget.
As the project progresses and your design becomes more detailed, you will need to develop a bill of materials to list all the parts needed for your project. Your school may have a template for you to fill out when submitting a purchase order, or you can use the one below.
II.5) Computer-Aided Design (CAD)
Information
Computer-Aided Design (CAD) is the use of software to create 3D models and 2D drawings of parts and assemblies for manufacturing. CAD is typically developed first in 3D as part models, and then those parts are combined into an assembly to show how the full system fits and moves together. Many CAD programs include capabilities for stress/strain or fluids simulation. The benefit of building a system in CAD is that parts and designs can easily be changed or refined, and you can make sure the whole system fits together and moves as expected, before spending the money on parts and time on building something that might not work as expected. It is an essential preliminary design step that can prevent costly mistakes.
Several different CAD programs exist and many are available to students at free or reduced cost. The most common ones are listed below, along with details on licensing, tutorials, and certifications.
- SolidWorks ($49/year for students but might be free through your school)
- AutoCAD (free for students)
- Onshape (free for students)
After creating 3D parts, the models can be inserted into 2D technical design drawings using planar views. Here, dimensions, hole callouts, and hidden lines can be noted, and the drawings used for manufacturing of custom parts (i.e. machining). This guide by Joel Schadegg explains tips and best practices for creating a good technical design drawing.
The video Engineering Design Drawings: How to Make Prints a Machinist Will Love, by tarkka, explains the different types of engineering drawings, shows step-by-step how to make, choose, and place views and dimension common features, and provides ASME standards and example detail and assembly drawings of real parts.
Activity
Build a 3D CAD model of your system to check the fit of all parts and verify that the dimensions meet the design constraints of your project. Make files for custom parts, and download files of purchased components from the manufacturers’ websites or other free sites like GrabCAD or 3D Content Central. Create 2D drawings of any custom parts so you have a detailed plan for fabrication.
II.6) Ecosystem Mapping
Information
A product’s design, features, cost, and profitability are affected by many factors. Ecosystem mapping is a way to identify all the external entities (people and organizations) affecting a project and see how your product fits into society. It shows the flow of materials, money, influence, and sabotage. This video explains how to make an ecosystem map and uses an example of an orthotic hand device.
Activity
Make a map of your project’s ecosystem. Include all people and organizations affecting the project, and link them with arrows showing the flow of materials, money, influence, and sabotage. Color-code the arrows or use different line types to distinguish between the different factors.
II.7) Market Analysis
Information
How much money can you make from your product? Is it profitable to enter the market? This shows how to analyze TAM, SAM, and SOM market sizes to determine possible revenue.
Activity
Now use the worksheet below to analyze the market for your own project. Determine the target candidates for your TAM, SAM, and SOM, and use the internet to search for statistics on their demographics as well as a reasonable price point for your project based on similar existing products. Remember to cite all your sources! Is your project predicted to be a profitable venture?
