Chapter Fourteen – Presentation Aids


A fountain resembling a faucet floating in midair gushing out an endless supply of water.

“Grifo mágico” by emijrp. CC-BY.

“I know you can’t read this from the back there,” the presenter apologizes to a screen so full of words you would think the entire speech had been crammed into one slide. This is just the first of a seemingly endless string of slides I can’t read, charts so full of numbers I can’t decipher the meaning, and clip art so clichéd I can’t help but roll my eyes and sigh. It is not long before I’m presented with an incredibly dense graph I can’t make any sense of since he keeps interrupting my concentration with actual talking. “When is he going to come to the point already?” I think to myself as I start to doodle in the margins of the handout of the PowerPoint slides for the very talk I’m currently sitting through. Why did he even bother with a presentation? He could have just emailed us all of the handout and saved us from this painful, dull spectacle. As he reads from his slides and belabors his statistics, my mind drifts to grocery lists and the upcoming weekend. I can think of a hundred better uses for an hour.


It seems nearly impossible to see a presentation that doesn’t revolve around a lengthy PowerPoint, so much so that you might think it was a requirement for giving a speech. The phrase “death by PowerPoint” was coined in response to the ubiquitous, wordy, and intellectually deadening presentations that focus on the slides rather than the content or the presenter. With the speaker reading directly from the slides, or worse, showing slides with text so small that it can’t be read, viewers are often left wondering what the need for the presentation is at all. A simple handout would convey the message and save everyone’s time. PowerPoint, however, is just one of the visual aids available to you as a speaker. Your ability to incorporate the right visual aid at the right time and in the right format can have a powerful effect on your audience. Because your message is the central focus of your speech, you only want to add visual aids that enhance your message, clarify the meaning of your words, target the emotions of your audience, and/or show what words fail to clearly describe.

A visual image is a simple thing, a picture that enters the eyes. – Roy H. Williams


Learning how to create effective visuals that resonate with your audience is important for a quality presentation. Understanding basic principles of how visual information is processed alone and in combination with audio information can make or break your visuals’ effectiveness and impact. Incorporating visuals into your speech that complement your words rather than stand in place of them or distract from them, will set you apart from other presenters, increase your credibility, and make a bigger and more memorable impact on your audience.


Types of Visual Aids

In the past, transparencies displayed with overhead projectors, posters, and flip charts were common visual aids, but these have mostly been replaced with computer technology. For many people, the term “visual aids” for presentations or speeches is synonymous with PowerPoint (often long, dry, painful PowerPoint at that), but this is just one type of visual aid. You should consider all the available options to determine what will be most effective and appropriate for your presentation.

If you wear clothes that don’t suit you, you’re a fashion victim. You have to wear clothes that make you look better. – Vivienne Westwood

Personal Appearance

Some people choose to dress up as part of their presentation, and this can help set the tone of the speech or reinforce a specific point. A speaker may wear a handmade sweater in a talk about knitting in order to inspire others to begin the hobby. Another speaker may opt for a firefighter’s uniform in a speech about joining the local volunteer fire department in an effort to appeal to the respect most people have for people in uniform. As mentioned in the previous chapter, if you’re delivering a speech on sleep deprivation, wearing pj’s could be appropriate!

If you wear clothes that don’t suit you, you’re a fashion victim. You have to wear clothes that make you look better. – Vivienne Westwood

If you aren’t dressing in relation to your topic, you should dress appropriately for your audience and venue. A presentation to a professional audience or at a professional conference would lend itself to appropriate business attire. If you are giving a presentation to your local Girl Scout troop, more casual clothing may be the best choice. Any time you are doing a demonstration, make sure you are dressed appropriately to give the demonstration. It is difficult for a speaker to show how to correctly put on a rock-climbing harness if she is wearing a skirt the day of the presentation.

Beyond dressing appropriately for your audience and topic, the audience will make judgments about you even before your presentation begins. Your dress, mannerisms, the way you greet the audience when they are arriving, how you are introduced, and the first words out of your mouth all impact your credibility and ability to connect with your audience. Make sure you are calm and welcoming to your audience when they arrive and greet them in a professional manner. Your credibility and professionalism suffer when the audience arrives and you are busy scrambling around attempting to finish your preparations.[1]

Objects and Props

Objects and props, such as a bicycle helmet for a speech on bike safety or an actual sample of the product you are trying to sell, can greatly enhance your presentation. Seeing the actual item will often make it easier for your audience to understand your meaning and will help you connect with your audience on an emotional level. Props can be used as part of demonstrations (discussed below) or as a stand-alone item that you refer to in your speech.

There are several important considerations for using props in your presentation. If you have a large audience, showing the prop at the front of the venue may mean that audience members can’t see the item. The alternative to this is to pass the item around, though Young and Travis[2] advise caution in passing objects around during your speech, as most people will be seeing the object after you have moved on with your talk. Having your prop out of sync with your presentation, either as it is passed around disrupting your audience’s attention or by having your prop visible when you aren’t talking about it, is distracting to your audience and message. To make the most effective use of props in your presentation, carefully consider how the object will be visible to your entire audience when you are speaking about it, and make sure it is out of sight when you are not.

Demonstration

A demonstration can serve two different purposes in a speech. First, it can be used to “wow” the audience. Showing off the features of your new product, illustrating the catastrophic failure of a poorly tied climbing knot, or launching a cork across the room during a chemistry experiment are all ways of capturing the audience’s attention. Demonstration should not be gimmicky, but should add value to your presentation. When done well, it can be the memorable moment from your speech, so make sure it reinforces the central message of your talk.

Demonstration can also be used to show how something is done. People have different learning styles, and a process demonstration can help visual learners better understand the concept being taught. Consider for a moment the difference between reading the instructions on how to perform CPR, watching someone perform CPR, and trying CPR on the training dummy. As evidenced by the huge number of online videos illustrating how to do something, there is great value in watching while you learn a new task.

If your presentation includes a process where seeing will improve understanding, consider including a demonstration.

Because you have a limited time to present, make sure your demonstrations are succinct, well-rehearsed, and visible to the entire audience. Be prepared for the demonstration to fail and have a back-up plan in place. It is better to move forward with your presentation than to fret with trying to get your demonstration perfect or fixed. However, if you are providing a demonstration of your new product, make sure it is as error free as possible. If you can’t be positive the product will perform as expected, it is better to skip the demonstration.

Posters and Flip Charts

If you are presenting to a small audience, around a dozen people, you may choose to use a poster rather than PowerPoint. The focus of your poster should be to support your core message and can be left behind to remind those in attendance of your presentation after you have left. Posters should look professional (e.g., not handwritten), be visible to everyone in the room, and follow design rules covered later in this chapter. Before your presentation, you should ask whether posters must be hung or be free standing. For posters that will be hung from a wall, sturdy poster or matte boards will suffice. If your poster is going to be free standing or if you are going to use the same poster for multiple presentations, you should consider using a tri-fold display board.

Poster Presentation of weather patterns

“Dad’s Jr. Year Science Fair Project” by Rev. Xanatos Satanicos Bombasticos. CC-BY-NC-SA.

Other text-based visual aids include white boards and flip charts. Both can be used to write or draw on during the presentation and should be used with several caveats. Writing during your presentation actually takes away from your speaking time, so make sure to factor this into your speaking time. Speaking and writing at the same time can be tricky because the audience will have a difficult time processing what they are hearing when they are also trying to read what you write. Additionally, if you are writing, you need to be careful not to turn your back on your audience, which is makes it harder for them to hear you and for you to connect with your audience. Legible handwriting that can be seen at a distance is of prime importance, so using these kinds of visual aids should be limited to small audiences. While some speakers write and draw to highlight important points, this takes an enormous amount of skill and practice. For those with less developed skills, flip charts are best limited to situations where audience input is necessary for the direction or continuation of the presentation.[3]


The soul never thinks without a picture. – Aristotle

Audio and Video

A large amount of digitized audio and video is now available to be included and embedded in your presentation. Select short clips; Young and Travis [4] recommend only 1020 seconds, but this will depend in part on the length of the presentation, the purpose of the presentation, and clip content and relevance. You should not have a presentation primarily composed of audio/video clips. Select only clips that reinforce the message or serve as an appropriate segue into your next topic.

When including audio or video in your speech, there are several technical considerations. It is important that the clip be properly cued to start at exactly where you want it to begin playing. It distracts from both your audience’s attention and your credibility when you are fumbling with technology during a speech. It is also important that your file format can be played on the computer you are using. Since not all computers will play all file formats, be sure to test playability and audio volume before your presentation. Again, going back to providing a professional appearance from your first interaction with your audience, you should iron out the technical details before they enter the room. As with a demonstration, if your clip isn’t playing properly, move on rather than attempt to correct the issue. Fumbling with technology is a waste of your audience’s valuable time.

Handouts

There are many schools of thought on the use of handouts during a presentation. The most common current practice is that the presenters provide a copy of their PowerPoint slides to the participants before or after the presentation. This is so common that some academic and professional conferences require presenters to submit their slides prior to the event, so copies of the slides can be made for each attendee. Despite this prevailing trend, you should avoid using your slides as handouts because they serve different purposes. Using your presentation slides as the handout both shortchanges your slides and fails as a handout.

U.S. soldier distributing handouts explaining symptoms of tuberculosis to local residents at Bunabun Health Center in Madang, Papua New Guinea.

“Lt. Lydia Battey distributes handouts” by Kerryl Cacho. Public domain.

Handouts are best used to supplement the content of your talk. If you are providing statistical data, your slide may only show the relevant statistic focusing on the conclusion you want your audience to draw. Your handout, on the other hand, can contain the full table of data. If you need to show a complex diagram or chart, a handout will be more legible than trying to cram all that information on a slide. Since you need to simplify the data to make it understandable on a slide, the handout can contain the evidence for your message in a way that is legible, detailed, complex, and shows respect for the audience’s time and intelligence.[5]

You don’t need to include everything in your talk, and you don’t need to pack all your information into your slides. Write a handout document with as much detail as you want and keep the slides simple. Presenters often feel the need to display all the data and information they have so they will appear knowledgeable, informed, and thoroughly prepared. You can help ease this feeling by creating a handout with all of the detailed data you wish, which leaves your slides open to focus on your key message.[6]

There are many true statements about complex topics that are too long to fit on a PowerPoint slide. – Edward Tufte

Crafting an appropriate handout will take additional time for the presenter but doing so will result in a take-away document that will stand on its own and a slide show that focuses on effective visual content. Duarte (2008) and Tufte (2003) recommend handouts only for dense, detailed information. Reynolds[7] expands on this idea, noting that your handout needs to be complete enough to stand in your place since you won’t be there to present the information or answer questions.

When to distribute handouts is also heavily debated. So common is the practice of providing handouts at the beginning of a presentation that it may seem wrong to break the convention. It is important to understand, however, that if people have paper in front of them while you are speaking, their attention will be split between the handout, your other visual aids, and your words. To counter this, you might consider distributing handouts as they are needed during the presentation and allowing time for people to review them before continuing on.[8] This may not be a viable option for shorter presentations, and the interruption in the flow of the presentation may be hard to recover from. Unless having the documents in front of your audience is absolutely critical to the success of the presentation, handouts should be distributed at the end of the presentation.

Slideware

Slideware is a generic term for the software used create and display slide shows such as Microsoft PowerPointApple iWorks KeynoteGoogle Drive PresentationZoho Show and others. Composed of individual slides, collectively known as the slide deck, slideware is a de facto standard for presentation visual aids despite criticisms and complaints about the format. In truth, the problem is not with the software but in the use of the software. The focus of much of the remainder of this chapter will be suggestions and best practices for creating effective slide decks that will be high impact and avoid many of the complaints of slideware detractors. Before this discussion, there are two distinct slideware presentation styles that should be mentioned.

A picture is a poem without words. – Horace

Pecha Kucha

Pecha Kucha is a method of presenting using a slide deck of 20 slides that display for 20 seconds per slide, advance automatically, and generally contain no text.[9] This method began in 2003 as a way to contain the length of presentations of architects and continues to grow in popularity, but is still reserved mostly for people in creative industries.[10] Because of the restrictive format, Pecha Kucha-style presentations help the speaker practice editing, pacing, connecting with the audience, focusing on the message, and using images in place of words.[11]

Prezi

While not quite slideware, Prezi is digital presentation software that breaks away from the standard slide deck presentation. It requires users to plot out their themes before adding primarily image-focused content.[12] Instead of flipping through the slide deck, the presenter zooms in and out of the presentation to visually demonstrate connections not available in other slideware. The design of the software lends itself toward more rapidly changing visuals. This helps to keep the viewer engaged but also lends itself to over-populating the blank canvas with images.[13]

Prezi’s fast-moving images and, at times, unusual movement can make users dizzy or disoriented. Careful work is needed during planning and practice so that the point of the talk isn’t the wow factor of the Prezi software, but that your visuals enhance your presentation. The best way to learn more about this emerging tool is to visit the Prezi website to view examples.

If opting to use Prezi in a corporate environment, you should strongly consider one of the paid options for the sole purpose of removing the Prezi logo from the presentation.


Now that you have a better understanding of the different types of presentation aids you could employ during your speech, let’s discuss effective design principles of visual aids.


Design Principles

Slide and slide show design have a major impact on your ability to get your message across to your audience. Research shows that people have trouble grasping information when it comes at them simultaneously. “They will either listen to you or read your slides; they cannot do both.”[14] This leaves you, the presenter, with a lot of power to direct or scatter your audience’s attention. This section will serve as an overview of basic design considerations that even novices can use to improve their slides.


Figure 13.1. Two Powerpoint slides. The 'Too Little Information' slide shows a bulleted list of types of bicycles. The 'Too Much Information' slide shows the names and definitions of five kinds of bicycles.

Figure 13.1 by the Public Speaking Project. CC-BY-NC-ND.

First and foremost, design with your audience in mind. Your slide show is not your outline. The show is also not your handout. As discussed earlier, you can make a significantly more meaningful, content-rich handout that complements your presentation if you do not try to save time by making a slide show that serves as both. Keep your slides short, create a separate handout if needed, and write as many notes for yourself as you need.

All decisions, from the images you use to their placement, should be done with a focus on your message, your medium, and your audience. Each slide should reinforce or enhance your message, so make conscious decisions about each element and concept you include[15] and edit mercilessly. Taken a step further, graphic designer Robin Williams[16] suggests each element be placed on the slide deliberately in relation to every other element on the slide.

Providing the right amount of information, neither too much nor too little, is one of the key aspects in effective communication.[17] See Figure 13.1 as an example of slides with too little or too much information. The foundation of this idea is that if the viewers have too little information, they must struggle to put the pieces of the presentation together. Most people, however, include too much information (e.g., slides full of text, meaningless images, overly complicated charts), which taxes the audience’s ability to process the message. “There is simply a limit to a person’s ability to process new information efficiently and effectively.”[18] As a presenter, reducing the amount of information directed at your audience (words, images, sounds, etc.) will help them to better remember your message.[19] In this case, less is actually more.


Powerpoint slide with bar graph, titled College Enrollment by Gender, 1970-2009

Figure 13.2 by the Public Speaking Project. CC-BY-NC-ND.

The first strategy to keeping your slides simple is to include only one concept or idea per slide. If you need more than one slide, use it, but don’t cram more than one idea on a slide. While many have tried to prescribe the number of slides you need based on the length of your talk, there is no formula that works for every presentation. Use only the number of slides necessary to communicate your message, and make sure the number of slides corresponds to the amount of time allotted for your speech. Practice with more and fewer slides and more and less content on each slide to find the balance between too much information and too little.


With simplicity in mind, the goal is to have a slide that can be understood in 3 seconds. Think of it like a billboard you are passing on the highway.[20] You can achieve this by reducing the amount of irrelevant information, also known as noise, in your slide as much as possible. This might include eliminating background images, using clear icons and images, or creating simplified graphs. Your approach should be to remove as much from your slide as possible until it no longer makes any sense if you remove more.[21]


Slide Layout

Figure 13.3. The top slide is low contrast. The heading and bullet points are all the same color, weight, and size. The background of the slide is a gradient gradually switching from black to beige. The bottom slide is high contrast. The heading and bullet points have different weights, and the first letter of each bullet point is a different size and color. The background is pale, while the lettering is dark.

Figure 13.3 by the Public Speaking Project. CC-BY-NC-ND.

It is easy to simply open up your slideware and start typing in the bullet points that outline your talk. If you do this, you will likely fall into the traps for which PowerPoint is infamous. Presentation design experts Reynolds[22] and Duarte[23] both recommend starting with paper and pen. This will help you break away from the text-based, bullet-filled slide shows we all dread. Instead, consider how you can turn your words and concepts into images. Don’t let the software lead you into making a mediocre slide show.

Regarding slide design, focus on simplicity. Don’t over-crowd your slide with text and images. Cluttered slides are hard to understand (see Figure 13.2). Leaving empty space, also known as white space, gives breathing room to your design. The white space actually draws attention to your focus point and makes your slide appear more elegant and professional. Using repetition of color, font, images, and layout throughout your presentation will help tie all of your slides together. This is especially important if a group is putting visuals together collaboratively. If you have handouts, they should also match this formatting in order to convey a more professional look and tie all your pieces together.[24]

Another general principle is to use contrast to highlight your message. Contrast should not be subtle. Make type sizes significantly different. Make contrasting image placements, such as horizontal and vertical, glaringly obvious. A general principle to follow: if things are not the same, then make them very, very different,[25] as in Figure 13.3.

A common layout design is called the rule of thirds. If you divide the screen using two imaginary lines horizontally and two vertically, you end up with nine sections. The most visually interesting and pleasing portions of the screen will be at the points where the lines intersect.


Figure 13.4. Both slides show a picture of a person leaping on a beach. In the centered slide, the image is cropped and centered so that the leaping figure is at the center of the slide. The quote is above the picture. In the rule-of-thirds slide, the picture takes up the entire slide. The leaping figure is on the right third of the slide, while the quote overlaps the photo in the top third of the slide.

Figure 13.4 by the Public Speaking Project. CC-BY-NC-ND.

Figure 13.5, Z pattern. A photo showing a man by some cliffs. Red arrows run along the top edge of the cliff toward the man, from the man to the bottom edge of the cliff, and then down along the bottom edge of the cliff. The arrows form a Z shape.

Figure 13.5 by the Public Speaking Project. CC-BY-NC-ND.

Figure 13.6. The top slide shows a photograph of a person reading a book and a statistic. The person is not looking at the statistic. The bottom slide shows a person sitting cross-legged by a river and a statistic. The person is facing the statistic.

Figure 13.6 by the Public Speaking Project. CC-BY-NC-ND.


Aligning your text and images with these points is preferred to centering everything on the screen.[26][27] See Figure 13.4. Feel free to experiment with the right and left aligned content for contrast and interest. Sticking with a centered layout means more work trying to make the slide interesting.[28]

Understanding how people view images (and thus slides) can help you direct the viewer’s attention to the main point of your slide. In countries that read text from left to right and top to bottom, like English-speaking countries, people tend to also read images and slides the same way. Starting in the upper left of the screen, they read in a Z pattern, exiting the page in the bottom right corner unless their vision is side-tracked by the objects they are looking at (as in Figure 13.5).

Viewers’ eyes are scanning from focus point to focus point in an image, so you need to consciously create visual cues to direct them to the relevant information. Cues can be created subtly by the placement of objects in the slide, by showing movement, or more obviously by using a simple arrow.[29] Make sure all people and pets are facing into your slide and preferably at your main point, as in Figure 13.6. If your slide contains a road, path, car, plane, etc., have them also facing into your slide. When the natural motion or gaze of your images points away from your slide, your viewers look that way too. Being aware of this and addressing the natural tendencies of people when viewing images can help you select images and design slides that keep the viewer engaged in your message.[30]

Backgrounds and Effects

PowerPoint and other slideware have a variety of templates containing backgrounds that are easy to implement for a consistent slide show. Most of them, however, contain distracting graphics that are counter to the simplicity you are aiming for in order to produce a clear message. It is best to use solid colors, if you even need a background at all. For some slide shows, you can make the slides with full-screen images, thus eliminating the need for a background color.

Graphic design is the paradise of individuality, eccentricity, heresy, abnormality, hobbies and humors. – George Santayana

Should you choose to use a background color, make sure you are consistent throughout your presentation. Different colors portray different meanings, but much of this is cultural and contextual, so there are few hard and fast rules about the meaning of colors. One universal recommendation is to avoid the color red because it has been shown to reduce your ability to think clearly. Bright colors, such as yellow, pink, and orange, should also be avoided as background colors, as they are too distracting. Black, on the other hand, is generally associated with sophistication and can be a very effective background as long as there is sufficient contrast with the other elements on your slide.[31]

When designing your presentation, it is tempting to show off your tech skills with glitzy transitions, wipes, fades, moving text, sounds, and a variety of other actions. These are distracting to your audience and should be avoided. They draw attention away from you and your message, instead focusing the audience’s attention on the screen. Since people naturally look at what is moving and expect it to mean something, meaningless effects, no matter how subtle, distract your audience, and affect their ability to grasp the content. Make sure that all your changes are meaningful and reinforce your message[32].

Colors

There are complicated and fascinating biological and psychological processes associated with color and color perception that are beyond the scope of this chapter. Because color can have such a huge impact on the ability to see and understand your visuals, this section will explore basic rules and recommendations for working with color.

Figure 13.7, warm and cool colors. A slide divided in half, with a cool blue color on one side and a warm orange color on the other. Words in different colors stretch across both halves to demonstrate the contrast. The words say warm colors, cool colors, tints are lighter, shades are darker. Warm colors is in warm colors, cool colors is in cool colors, tints are lighter is in a tint similar to the cool background, and shades are darker is in a shade similar to the warm background. It is clear that warm colors are easier to read against a cool background, cool colors are easier to read against a warm color, tints are hard to read against a similar tint, and shades are hard to read against a similar shade.

Figure 13.7 by the Public Speaking Project. CC-BY-NC-ND.

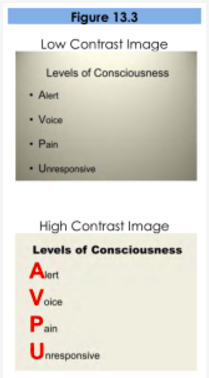
Much of what we perceive in terms of a color is based on what color is next to it. Be sure to use colors that contrast so they can be easily distinguished from each other (think yellow and dark blue for high contrast, not dark blue and purple). High contrast improves visibility, particularly at a distance. To ensure you have sufficient contrast, you can view your presentation in greyscale either in the software if available or by printing out your slides on a black and white printer.[33]


Color does not add a pleasant quality to designit reinforces it. – Pierre Bonnard

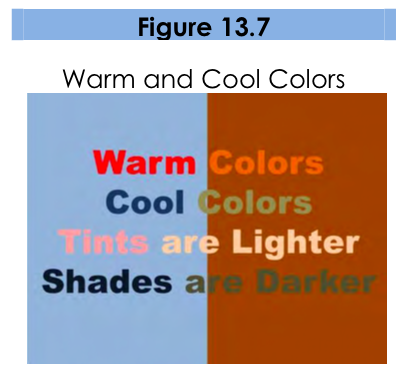
As seen in Figure 13.7, warm colors (reds, oranges, yellows) appear to come to the foreground when set next to a cool color (blues, grays, purples) which recede into the background. Tints (pure color mixed with white, think pink) stand out against a darker background. Shades (pure color mixed with black, think maroon) recede into a light background.[34] If you want something to stand out, these color combination rules can act as a guide.

Figure 13.8. Two color wheels. The top wheel shows complementary colors, in this example, purple and yellow, are opposite each other on the color wheel. The analogous color wheel shows that analogous colors, in this example yellow, yellow-orange, and orange, are next to each other on the color wheel.

Figure 13.8 by the Public Speaking Project. CC-BY-NC-ND.

Avoid using red and green closely together. Red-green color blindness is the predominate form of color blindness, meaning that the person cannot distinguish between those two colors (Vorick, 2011). There are other forms of color blindness, and you can easily check to see if your visuals will be understandable to everyone using an online tool such as the Coblis Color Blindness Simulator to preview images as a color-blind person would see it. Certain red-blue pairings can be difficult to look at for the non-color blind. These colors appear to vibrate when adjacent to each other and are distracting and sometimes unpleasant to view.[35]

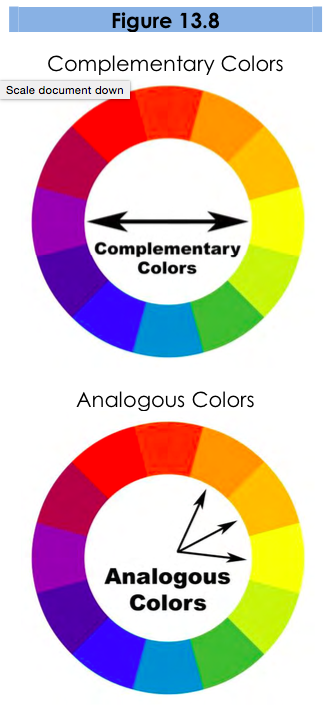
With all these rules in place, selecting a color palette, the group of colors to use throughout your presentation, can be daunting. Some color pairs, like complementary colors or analogous colors as in Figure 13.8, are naturally pleasing to the eye and can be easy options for the color novice. There are also online tools for selecting pleasing color palettes using standard color pairings including Kuler and Color Scheme Designer. You can also use websites like Colorbrewer to help identify an appropriate palette of colors that are visually distinct, appropriate for the colorblind, and that will photocopy well, should you decide to also include this information in a handout.

I’m a visual thinker, not a language-based thinker. My brain is like Google Images. – Temple Grandin


Fonts

Figure 13.9. A list of bad font effects. Each term is in a font demonstrating the style. Script fonts is a cursive, flourished style. Decorative fonts is a medieval, short-stroked, thick style. Upper case is in only capitalized letters. All bold is bolded. Small Caps is all capitalized, with the first letter of each word slightly larger. Shadows has a lighter, slanted shadow behind it. Outlines is thinly outlined. Word Art is written on a curved baseline. Stretched has short, wide letters with lots of space between each letter.

Figure 13.9 by the Public Speaking Project. CC-BY-NC-ND.

There are thousands of fonts available today. One might even say there has been a renaissance in font design with the onset of the digital age. Despite many beautiful options, it is best to stick to standard fonts that are considered screen friendly. These include the serif fonts Times New Roman, Georgia, and Palatino, and the sans serif fonts Ariel, Helvetica, Tahoma, and Veranda.[36] These fonts work well with the limitations of computer screens and are legible from a distance if sized appropriately. Other non-standard fonts, while attractive and eye-catching, may not display properly on all computers. If the font isn’t installed on the computer you are presenting from, the default font will be used which alters the text and design of the slide.


Readability is a top concern with font use, particularly for those at the back of your audience, furthest from the screen. After you have selected a font (see previous paragraph), make sure that the font size is large enough for everyone to read clearly. If you have the opportunity to use the presentation room before the event, view your slides from the back of the room. They should be clearly visible. This is not always possible and should not be done immediately preceding your talk, as you won’t have time to effectively edit your entire presentation. Presentation guru Duarte[37] describes an ingenious way to test visibility from your own computer.

Measure your monitor diagonally in inches, display your slides, then step back the same number of feet as you measured on your monitor in inches. For example, if you have a 17-inch screen, step back 17 feet to see what is legible.

Create your own visual style… let it be unique for yourself and yet identifiable for others. – Orson Welles


In addition to font style and size, there are other font “rules” to improve your slides:

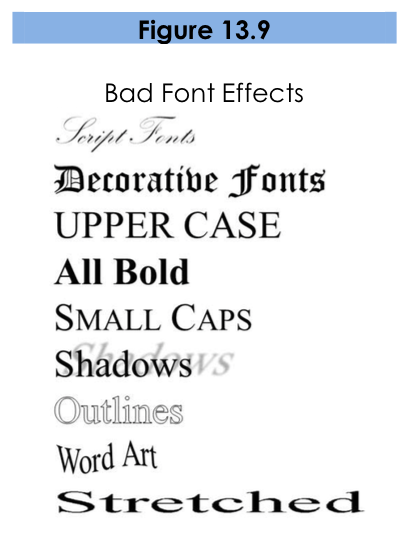
  • Don’t use decorative, script, or visually complex fonts.
  • Never use the Comic Sans font if you want to retain any credibility with your audience.
  • If you must use more than one font, use one serif font and one sans serif font.
  • Use the same font(s) and size(s) consistently throughout your presentation.
  • Don’t use all upper case or all bold.
  • Avoid small caps and all word art, shadows, outlines, stretching text, and other visual effects.
  • Use italics and underlines only for their intended purposes, not for design.

While there are many rules listed here, they can be summarized as” keep it as simple as possible.”[38] See Figure 13.9 for examples of poor font choices.


Text

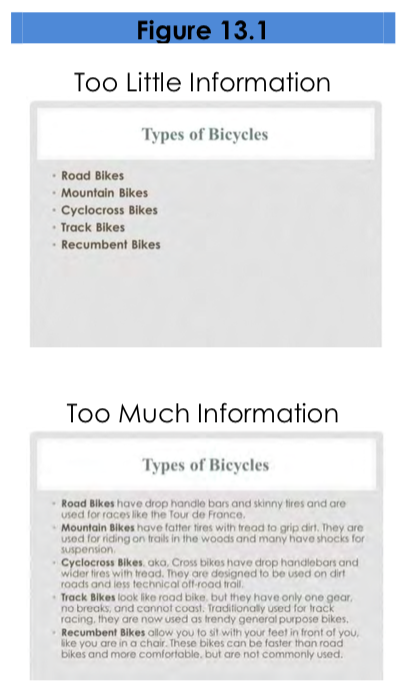
Nothing is more hotly debated in slide design than the amount of text that should be on a slide. Godin says “no more than six words on a slide. EVER.”[39] Other common approaches include the 5×5 rule5 lines of text, 5 words per line—and similar 6×6 and 7×7 rules.[40] Even with these recommendations, it is still painfully common to see slides with so much text on them that they can’t be read by the audience. The type has to be so small to fit all the words on the slide that no one can read it. Duarte[41] keenly points out that if you have too many words, you no longer have a visual aid. You have either a paper or a teleprompter, and she recommends opting for a small number of words.

Once you understand that the words on the screen are competing for your audience’s attention, it will be easier to edit your slide text down to a minimum. The next time you are watching a presentation and the slide changes, notice how you aren’t really grasping what the speaker is saying, and you also aren’t really understanding what you are reading. Studies have proved this split-attention affects our ability to retain information;[42] so when presenting, you need to give your audience silent reading time when you display a new slide. That is: talk, advance to your next slide, wait for them to read the slide, and resume talking. If you consider how much time your audience is reading rather than listening, hopefully you will decide to reduce the text on your slide and return the focus back to you, the speaker, and your message.

There are several ways to reduce the number of words on your page, but don’t do it haphazardly. As previously discussed, instead of simply abbreviating your message to make it “fit,” consider turning as many concepts as possible into images. Studies have shown that people retain more information when they see images that relate to the words they are hearing.[43] And when people are presented information for a very short time, they remember images better than words.[44]


TIP

An easy way to judge how much time your audience needs to read your slide silently, is to read the slide text to yourself in reverse order.

Figure 13.10, Quotations on Slides. A large black-and-white photograph showing two men in historical clothing standing on a cliff. Several mountains are behind them. A quote reads 'Government protection should be thrown around every wild grove and forest on the mountains.'

Figure 13.10 by the Public Speaking Project. CC-BY-NC-ND.


The ubiquitous use of bulleted lists is also hotly debated. PowerPoint is practically designed around the bulleted-list format, even though is it regularly blamed for dull, tedious presentations with either overly dense or overly superficial content.[45] Mostly this format is used (incorrectly) as a presenter’s outline. “No one can do a good presentation with slide after slide of bullet points. No One.[46] Reserve bulleted lists for specifications or explaining the order of processes. In all other cases, look for ways to use images, a short phrase, or even no visual at all.

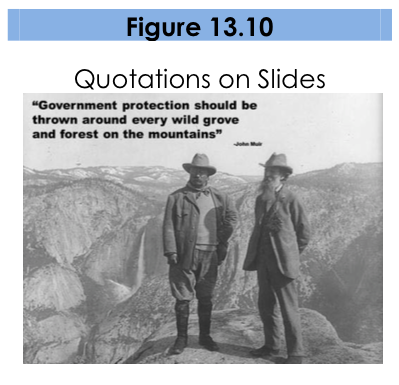
Quotes, on the other hand, are not as offensive to design when they are short, legible, and infrequently used. They can be a very powerful way to hammer a point home or to launch into your next topic.[47] See Figure 13.10 for an example. If you do use a quote in your slide show, immediately stop and read it out loud or allow time for it to be read silently. If the quote is important enough for you to include it in the talk, the quote deserves the audience’s time to read and think about it. Alternately, use a photo of the speaker or of the subject with a phrase from the quote you will be reading them, making the slide enhance the point of the quote.

Images

Images can be powerful and efficient ways to tap into your audience’s emotions. Use photographs to introduce an abstract idea, to evoke emotion, to present evidence, or to direct the audience attention, just make sure it is compatible with your message.[48] Photos aren’t the only images available. You might consider using simplified images like silhouettes, line art, diagrams, enlargements, or exploded views, but these should be high quality and relevant. Simplified can be easier to understand, particularly if you are showing something that has a lot of detail. Simple images also translate better than words to a multicultural audience.[49] In all cases, choose only images that enhance your spoken words and are professional quality. This generally rules out the clip art that comes with slideware, whose use is a sign of amateurism. Select high-quality images and don’t be afraid to use your entire slide to display the image. Boldness with images often adds impact.

When using images, do not enlarge them to the point that the image becomes blurry, also known as pixelation. Pixelation, (Figure 13.11) is caused when the resolution of your image is too low for your output device (e.g. printer, monitor, projector). When selecting images, look for clear ones that can be placed in your presentation without enlarging them. A common practice is to use images over 1,000 pixels wide for filling an entire slide. If your images begin to pixelate, either reduce the size of the image or select a different image.

Figure 13.11, Pixelated image. A very blurry and pixelated picture of a person with hands on hips.

Figure 13.11 by the Public Speaking Project. CC-BY-NC-ND.

Figure 13.12, a watermarked image. Photo shows a sunflower. A white X and the word "StockPhoto" cover the image.

Figure 13.12 by the Public Speaking Project. CC-BY-NC-ND.

Never use an image that has a watermark on it, as in Figure 13.2. A watermark is text or a logo that is placed in a digital image to prevent people from re-using it. It is common for companies that sell images to have a preview available that has a watermark on it. This allows you, the potential customer, to see the image, but prevents you from using the image until you have paid for it. Using a watermarked image in your presentation is unprofessional. Select another image without a watermark, take a similar photo yourself, or pay to get the watermark-free version.

You can create images yourself, use free images from places like Pexels, or pay for images from companies like iStockphoto for your presentations. Purchasing images can get expensive quickly and searching for free images is time consuming. Be sure to only use images that you have permission or rights to use and give proper credit for their use. If you are looking for free images, try searching the Creative Commons database for images from places like Flickr, Google, and others. The creators of images with a Creative Commons License allow others to use their work, but with specific restrictions. What is and isn’t allowed is described in the license for each image. Generally, images can be used in educational or non-commercial settings at no cost as long as you give the photographer credit. Also, images created by the U.S. government and its agencies are copyright free and can be used at no cost.

One final consideration with using images: having the same image on every page, be it part of the slide background or your company logo, can be distracting and should be removed or minimized. As mentioned earlier, the more you can simplify your slide, the easier it will be for your audience to understand your message.

Graphs and Charts

As we mentioned in the chapter on support materials, if you have numerical data that you want to present, consider using a graph or chart. You are trying to make a specific point with the data on the slide, so make sure that the point—the conclusion you want your audience to drawis clear. This may mean that you reduce the amount of data you present, even though it is tempting to include all of your data on your slide.

It is best to minimize the amount of information and focus instead on the simple and clear conclusion.[50] You can include the complete data set in your handout if you feel it is necessary.[51] Particularly when it comes to numerical data, identify the meaning in the numbers and exclude the rest. “Audiences are screaming ‘make it clear,’ not ‘cram more in.’ You won’t often hear an audience member say, ‘That presentation would have been so much better if it were longer.”[52] In some cases you can even ditch the graph altogether and display the one relevant fact that is your conclusion.

Figure 13.13. Complex chart shows a bar graph with many thin bars in two different colors. The chart shows a bar graph with about four sets of different colored bars. The simple graphic shows two labeled arrows.

Figure 13.13 by the Public Speaking Project. CC-BY-NC-ND.

Figure 13.14. Pie chart, a circle with a certain percent of the circle in one color and the rest in another color. A line graph with two lines in different colors on a graph. Bar chart, a series of vertical bars in two different colors.


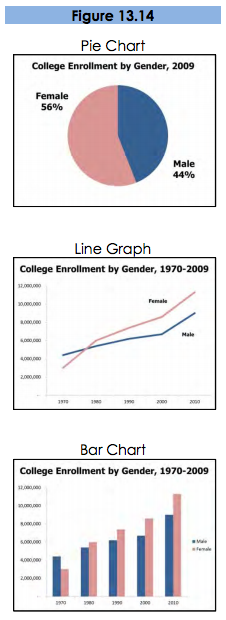
Different charts have different purposes, and it is important to select the one that puts your data in the appropriate context to be clearly understood.[53] Pie charts show how the parts relate to the whole and are suitable for up to eight segments, as long as they remain visually distinct.[54] Start your first slice of the pie at 12:00 with your smallest portion and continue around the circle clockwise as the sections increase in size. Usea line graph to show trends over time or how data relates or interacts. Bar charts are good for showing comparisons of size or magnitude[55] and for showing precise comparisons.[56] There are other types of charts and graphs available, but these are the most common.

When designing charts, one should use easily distinguishable colors with clear labels. Be consistent with your colors and data groupings.[57] For clarity, avoid using 3-D graphs and charts, and remove as much of the background noise (lines, shading, etc.) as possible.[58] All components of your graph, once the clutter is removed, should be distinct from any background color. Finally, don’t get too complex in any one graph, make sure your message is as clear as possible, and make sure to visually highlight the conclusion you want the audience to draw.


References

  1. Duarte, N. (2010). Resonate: Present visual stories that transform audiences. Hoboken, NJ: John Wiley & Sons. 
  2. Young, K. S., & Travis, H. P. (2008). Oral communication: Skills, choices, and consequences (2nd ed.). Long Grove, IL: Waveland Press. 
  3. Duarte, N. (2008). Slide:ology: The art and science of creating great presentations. Sebastopol, CA : O’Reilly Media. 
  4. Young, K. S., & Travis, H. P. (2008). Oral communication: Skills, choices, and consequences (2nd ed.). Long Grove, IL: Waveland Press. 
  5. Tufte, E. R. (2003). The cognitive style of PowerPoint. Cheshire, CT: Graphics Press. 
  6. Reynolds, G. (2008). Presentation Zen: Simple ideas on presentation design and delivery. Berkeley, CA: New Riders. 
  7. Reynolds, G. (2008). Presentation Zen: Simple ideas on presentation design and delivery. Berkeley, CA: New Riders. 
  8. Vasile, A. J. (2004). Speak with confidence: A practical guide (9th ed.). Boston, MA: Pearson. 
  9. Duarte, N. (2008). Slide:ology: The art and science of creating great presentations. Sebastopol, CA : O’Reilly Media. 
  10. Lehtonen, M. (2011). Communicating competence through PechaKucha presentations. Journal of Business Communication48(4), 464481. 
  11. Beyer, A. (2011). Improving student presentations: Pecha Kucha and just plain PowerPoint. Teaching of Psychology38(2), 122126. 
  12. Panag, S. (2010). A Web 2.0 Toolkit for Educators. Youth Media Reporter, 48991. 
  13. Yee, K., & Hargis, J. (2010). PREZI: A different way to present. Turkish Online Journal of Distance Education (TOJDE)11(4), 9–11. 
  14. Duarte, N. (2008). Slide:ology: The art and science of creating great presentations. Sebastopol, CA : O’Reilly Media. 
  15. Reynolds, G. (2008). Presentation Zen: Simple ideas on presentation design and delivery. Berkeley, CA: New Riders. 
  16. Williams, R. (2004). The nondesigner’s design book: Design and typographic principles for the visual novice (2nd ed.). Berkeley, CA: Peachpit Press. 
  17. Kosslyn, S. M. (2007). Clear and to the point: 8 psychological principles for compelling PowerPoint presentations. New York, NY: Oxford University Press. 
  18. Reynolds 2008 
  19. Mayer, R. E. (2001). Multimedia learning. Cambridge, UK: Cambridge University Press. 
  20. Duarte, N. (2010). Resonate: Present visual stories that transform audiences. Hoboken, NJ: John Wiley & Sons. 
  21. Reynolds 2008 
  22. Reynolds 2008 
  23. Duarte 2010 
  24. Reynolds 2008 
  25. Williams 2004  
  26. Kadavy, D. (2011). Design for hackers: Reverse-engineering beauty. West Sussex, UK : John Wiley & Sons 
  27. Reynolds 2008 
  28. Williams 2004 
  29. Malamed, C. (2009). Visual language for designers: Principles for creating graphics that people understand. Beverly, MA: Rockport Publishers. 
  30. Duarte 2008 
  31. Kadavy 2011 
  32. Duarte 2008; Kosslyn 2007 
  33. Bajaj, G. (2007). Cutting edge PowerPoint 2007 for dummies. Hoboken, NJ: Wiley Publishing. 
  34. Kadavy 2011 
  35. Kosslyn 2007 
  36. Kadavy 2011 
  37. Duarte 2008 
  38. Kadavy 2011; Kosslyn 2007 
  39. Reynolds 2008 
  40. Weaver, M. (1999). Reach out through technology: Make your point with effective A/V. Computers in Libraries19(4), 62. 
  41. Duarte 2008 
  42. Mayer 2001 
  43. Mayer 2001 
  44. Reynolds 2008 
  45. Tufte 2003 
  46. Reynolds 2008 
  47. Reynolds 2008 
  48. Kosslyn 2007 
  49. Malamad 2009 
  50. Duarte 2008 
  51. Reynolds 2008 
  52. Duarte 2008 
  53. Tufte 2003 
  54. Duarte 2008 
  55. Kosslyn 2007 
  56. Duarte 2008 
  57. Kosslyn 2007 
  58. Reynolds 2008 
LICENSES AND ATTRIBUTIONS
CC LICENSED CONTENT, SHARED PREVIOUSLY

License

Icon for the Creative Commons Attribution-NonCommercial-ShareAlike 4.0 International License

Principles of Public Speaking Copyright © 2022 by Katie Gruber is licensed under a Creative Commons Attribution-NonCommercial-ShareAlike 4.0 International License, except where otherwise noted.

Share This Book